Maxwell Creek Watershed Project Field Files Part 3: Mapping the watershed
Spatial data tells geographically, temporally, and ecologically informative stories. Understanding land-use and ecological change over time is essential to making decisions about the future of ecologically sensitive areas.
Multiple practitioners working under the umbrella of the Maxwell Creek Watershed Project (MCWP or “the Project”) have contributed to this third instalment of the Field Files series, a photo essay illustrating the important role spatial data and mapping plays in establishing landscape-wide restoration projects. All maps were made by Nicholas Courtier, who also assisted with map captions. Ruth Waldick from Transition Salt Spring and Shauna Doll from Raincoast Conservation Foundation contributed to building a narrative around these maps.
All maps were made by Nicholas Courtier
Getting started
One of the first steps to initiate this Project was to compile satellite imagery, ecological and biophysical maps, data layers, and any other field data from the watershed to begin to understand surface water flows, hydrological features, forest structure, and land-use history among other things. Spatial data has been further supported by a growing assortment of field observations from fixed, long-term monitoring stations (water flows, forest and vegetation plots, etc), experimental/treatment plots, data loggers and wildlife cameras.
Ultimately, this work aims to tackle the complexities of addressing cumulative impacts of climate change on local ecosystems while also navigating interagency collaboration. The goal of the Project is to better understand and define the efficacy of nature-based solutions, such as the installation of green infrastructure, in increasing climate resilience and enhancing ecological integrity and biodiversity.
There are three actionable objectives of the Project
- Forest restoration
Like on many Gulf Islands, intensive silvicultural (i.e. timber harvest) activities on Salt Spring Island throughout the 20th century shifted structurally complex and biodiverse Coastal Douglas-fir (CDF) forests to stands that are predominantly homogenous in age, with limited species diversity, closed canopies (i.e. dark), and a lack of wildlife and wildlife features (e.g. wildlife trees, coarse woody debris, etc.). This is certainly the case in the Maxwell Creek Watershed. Despite more than 20 years of protection, the forests within this watershed are dominated by silvicultural characteristics (i.e. dense, low-diversity, and even-aged).
This has implications for biodiversity and increases vulnerability to climate change/weather extremes. The MCWP focuses on developing, testing, and demonstrating techniques to recover ecological functions and reduce fire hazards within modified forests of the Southern Gulf Islands.
- Wetland restoration
Climate induced drought, extreme heat, and exceptional rainfall events have increased the frequency and severity of local emergencies such as road washouts, landslides, and loss of electricity and emergency services. The state of ecosystems in the Maxwell Creek Watershed exemplifies the extent of modification imposed on the landscape since settler arrival in the late 1800’s. This includes the loss of approximately 75% of wetlands from this area. The MCWP aims to understand and define priority areas for restoring wetland functions lost due to the installation of roads, ditches, and agricultural drainage systems.
- Baseline observational studies
As described above, the Project has been designed to increase fire resilience and ecological integrity in forests and wetland ecosystems. Restoring a more complex forest structure requires an understanding of historic and baseline conditions. This means collecting information on factors creating areas of high vulnerability (eg., fire, washout/flooding, loss of biodiversity/habitat), and identifying key variables influencing ecological functionality in the watershed.
The study area: Maxwell Creek Watershed
The following photo essay describes the role spatial data has and will continue to play in helping the Project’s community of practice to achieve these goals.
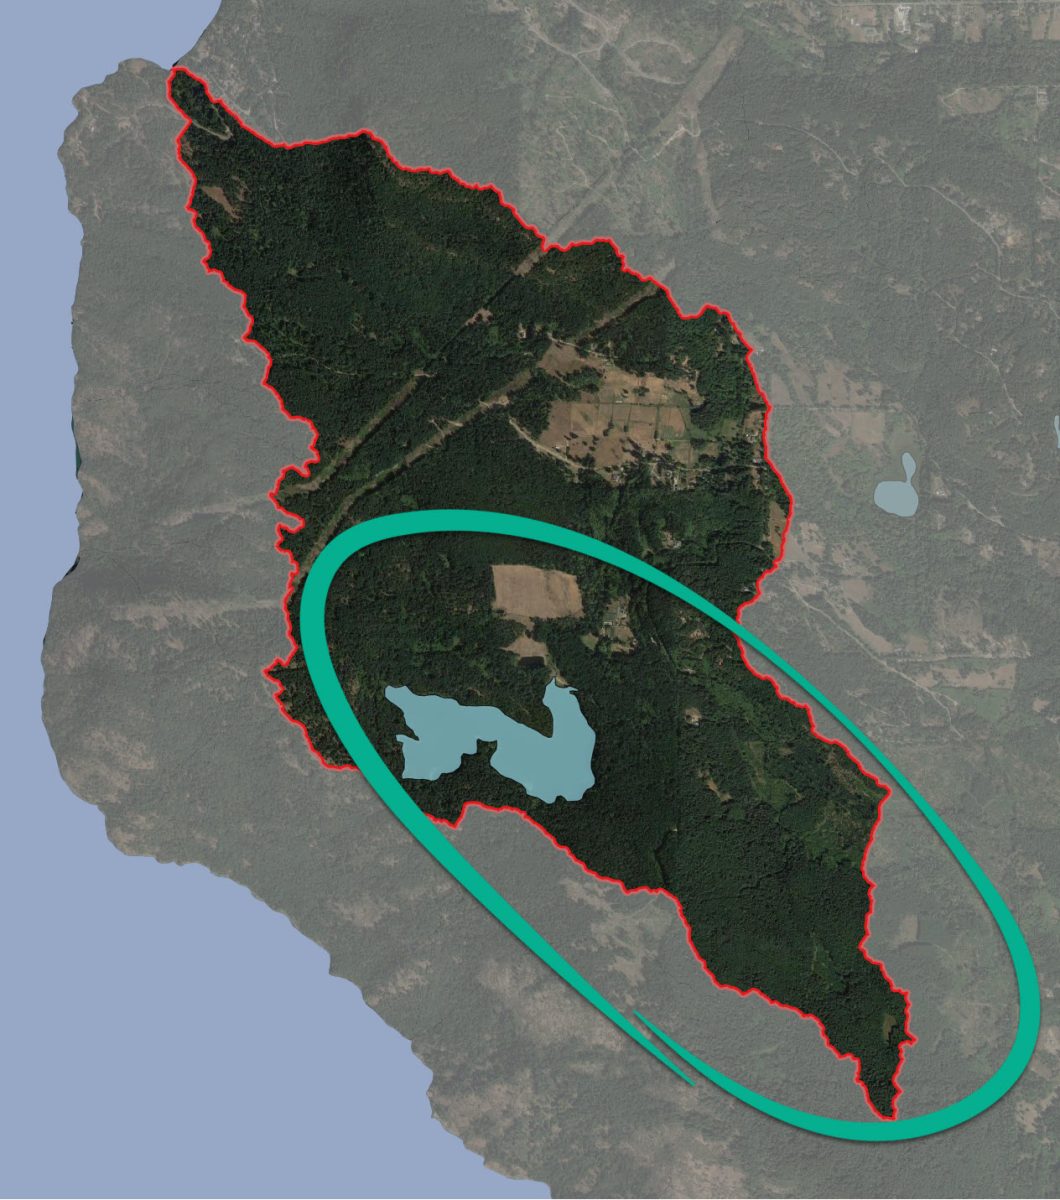
The Maxwell Creek Watershed was chosen as an area of focus for a number of reasons. In addition to being a protected area at low risk of future development and disturbance, the watershed is essential to the resilience of the Salt Spring Island community. It supplies potable water to nearly 50% of year-round island residents, including the Village of Ganges and the hospital. Maps 1 through 17 will provide additional information about the study area, land-use history, and many other additional details that have been considered in the design and implementation of the MCWP.
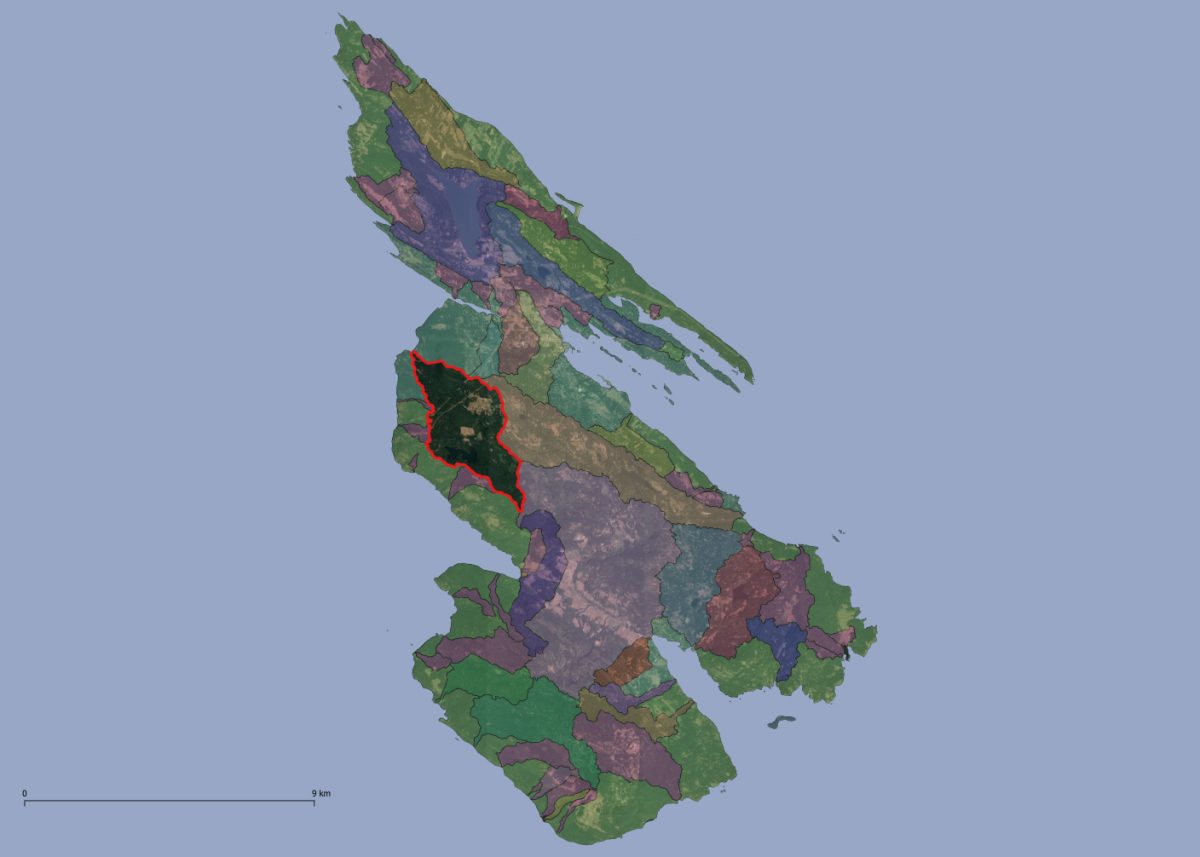
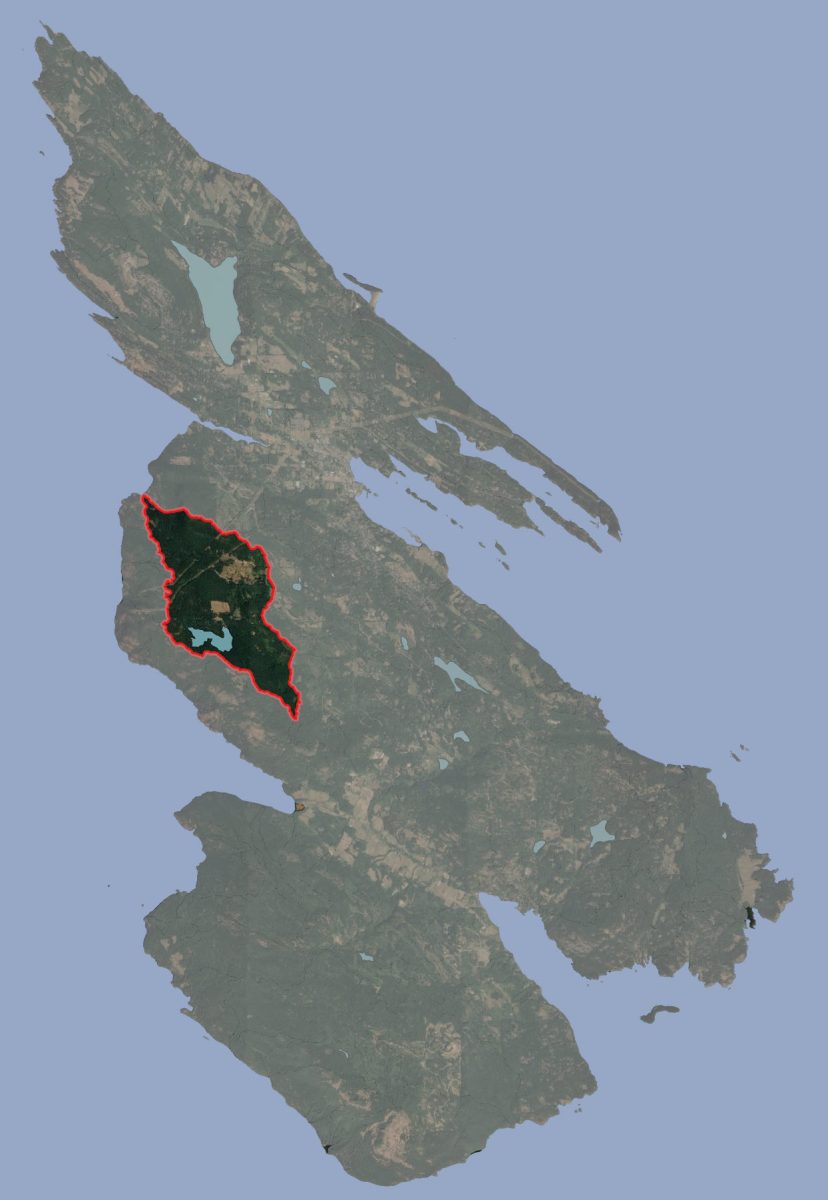
Maxwell Creek Watershed is outlined in red and Maxwell Lake is highlighted in blue. The watershed is currently well protected through private and public covenants, protected areas, and parks.
Tip: QGIS (Welcome to the QGIS project!) and Google Earth Pro (Earth Versions – Google Earth) offer an alternative to costly proprietary software for GIS analysis and mapping.
Key data layers
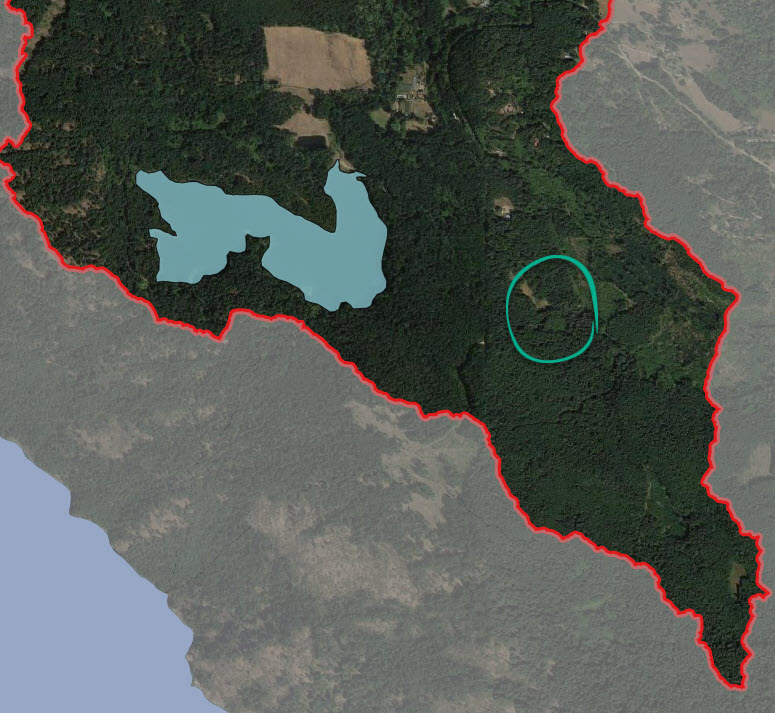
Each map in this collection was taken from the same area within the Maxwell Creek Watershed as noted in the caption of Map 4. By featuring the same area overlaid with different spatial data layers, we are able to demonstrate how different layers can tell different stories about the same place.

Aerial imagery provides a historic record of land-use change over time. These images are essential to understanding baseline ecological conditions. As shown in the image above, timber harvest was once a large-scale and recurring activity within the Maxwell Creek Watershed. This explains the structural and age homogeneity within present-day forests in this area. Compare this photo with the satellite and bare earth images in Maps 6 and 7. The site of the original Maxwell Farmstead appears in the top left.
Considerations: Aerial photos may be obtained at a cost (Digital Air Photos of B.C. – Province of British Columbia (gov.bc.ca). Images are not georeferenced, and technical skills are required to process and interpret images.
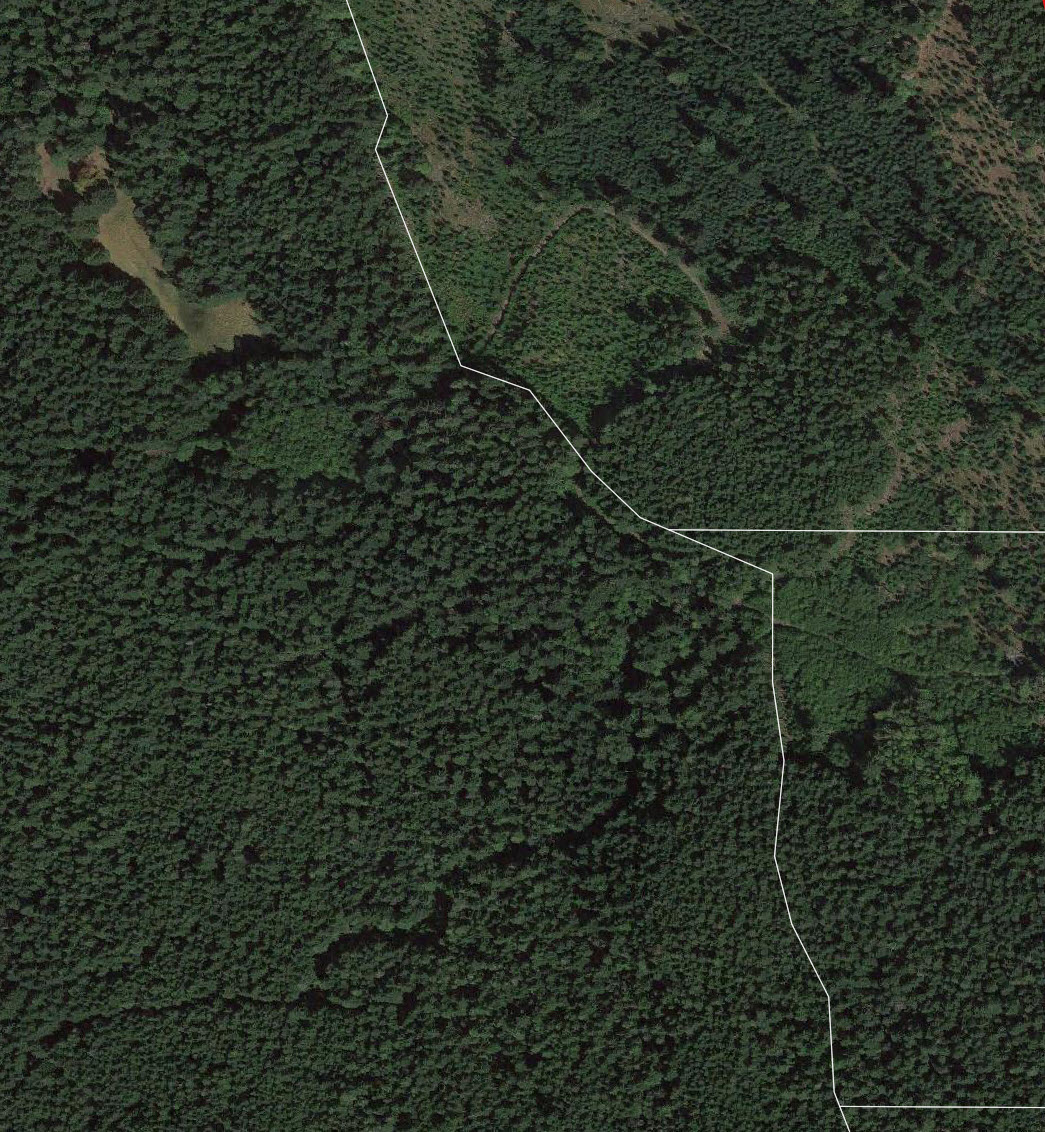
Similar to aerial imagery, but taken at a much wider geographic scale and at a higher level of detail, satellite imagery provides snapshots in time of the different features (e.g. buildings, roads, vegetation) on the Earth’s surface. In the ecological context, scientists and other practitioners can identify and differentiate features at a landscape level, helping to identify potential sites for collecting information on vegetation coverage, canopy, and changes in land cover over time.
Looking between Maps 5 and 6 will highlight that natural regeneration since 1946 has closed much of the canopy in this area. Intrusion into the old farmstead by trees is visible, and a site visit showed that the remaining open area is due to a high water table in the area. The site was formerly a wet meadow.
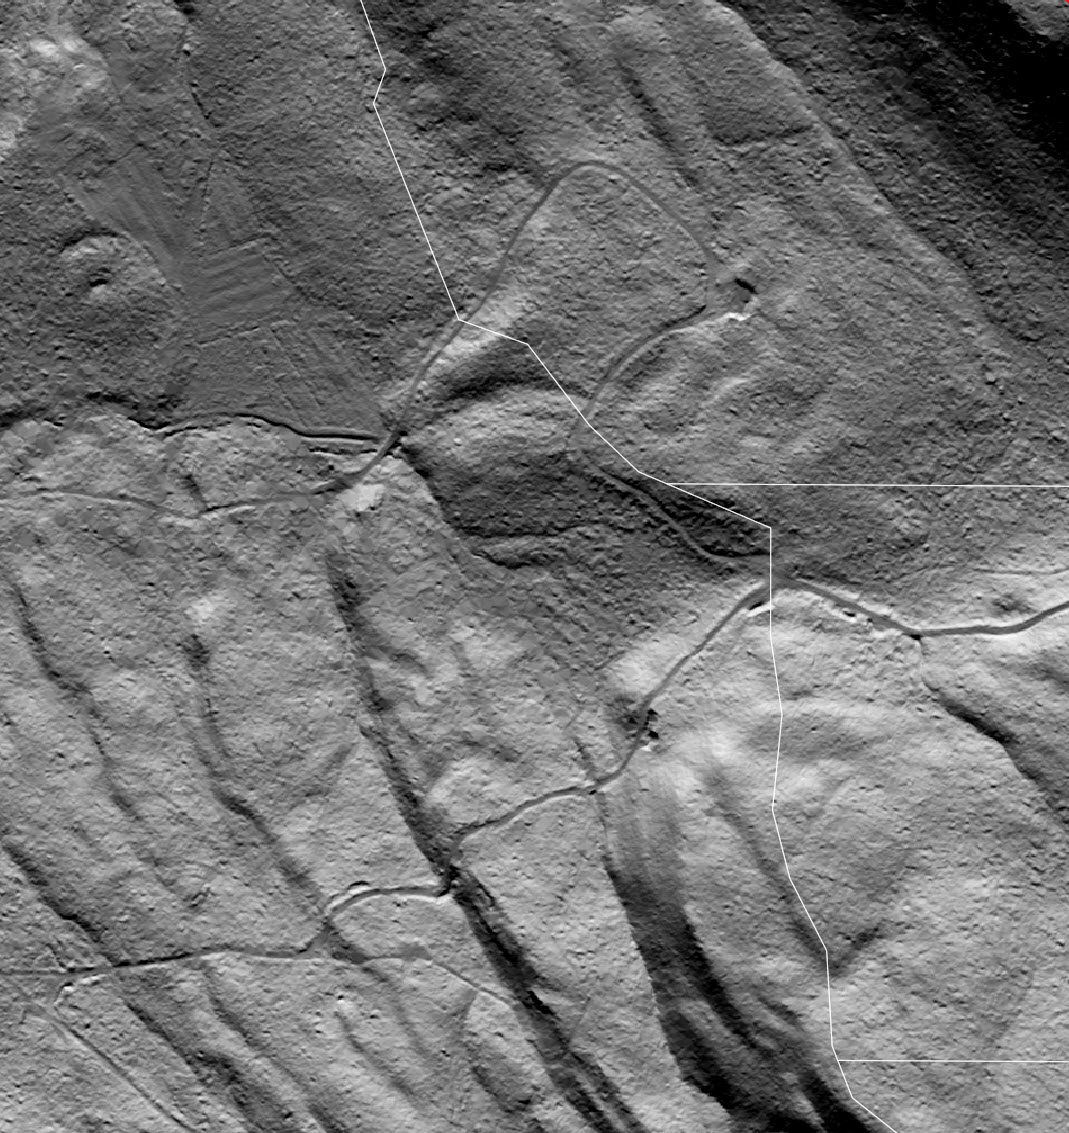
This LiDAR Digital Elevation Model (DEM) covers the same area seen in Maps 5 and 6. However, rather than treetops it shows the bare earth surface and reveals, along with the geological features, human disturbance – such as old roadbeds, many of which are now trails or access routes, ditches, and agricultural drainage – and other items of interest not visible with aerial photography. In other words, it shows what is under the trees.
This map shows several depressions where water is able to accumulate, including the former farm site (top left).
Considerations: Bare earth information is incredibly useful for highlighting linear features and exposing hidden features. For example, linear features in the former farm fields run perpendicular to the movement of water, serving as drainage and irrigation infrastructure. Although the farm has not operated in over 20 years, the drainage system remains, meaning without its removal the wet meadow will be unable to recover.

Light Detection and Ranging (LiDAR) provides detailed and accurate three-dimensional characterization of vertical forest structure, including tree height, basal area, and even tree type. As the MCWP is focused on fire, and preventing the movement of fire into the canopy (i.e., reducing potential catastrophic canopy fire), the high density of trees and absence of natural gaps and structural complexity using LiDAR informs fire hazard and risk assessment. Considerations: LiDAR interpretation requires advanced GIS technical abilities.

Tallest trees in green. LiDAR tree height information helps to highlight specific information that may not otherwise be apparent.
In this case, the tallest trees are shown in green, and the shortest canopy (trails/low shrubs/grasses) are shown in yellow and pale brown. This information has proven extremely valuable in detecting areas of higher soil moisture, even when there are no streams or wetlands present (due to extent of ditching, draining, etc).
The green area of tall trees indicates areas of good growing conditions, and provides information about potential water availability across the landscape.

Satellite data can be used over time to map out areas of harvest. Organizations like Global Forest Watch produce annual maps showing the area of forest lost. This type of information allows tree age and regeneration to be evaluated from a ‘zero’ or baseline year.
Official planting and harvesting maps are sometimes available. In this case detailed breakdowns of cut blocks and their delineations are provided. If the limits of blocks in this map (from December, 2000) are compared to the variation in tree canopy in Map 10, the influence of these cutblocks is still visible on the landscape.
Considerations: These maps can be hard to track down and are often not available in digital format. They provide additional information about trees harvested and historic forest attributes. However, expertise is required to interpret this information.

The British Columbia VRI is used to describe the location of a resource (e.g. trees to be harvested) and the amount of timber/woody material in a given unit area. VRI begins with photo interpretation to estimate vegetation features within polygons, and is followed by ground sampling to collect the detailed information about tree age, basal area, tree height, volume and composition, as well as ecological characteristics.
Considerations: Although a generalized representation of forest characteristics, and forestry-derived, VRI units provide useful information about forest stands and are comparable to Terrestrial Ecosystem Mapping (TEM) or Sensitive Ecosystem Inventory (SEI) polygons.

Records of historic fires, including the date and area burned, are being used to understand past fire events (the ones shown in this map are both large scale forestry-related burns). In the Maxwell Creek Watershed, there is an absence of historic stumps and coarse woody materials on the ground due to the occurrence of large intense fires. Without these historic forest attributes, it is a challenge to understand the ecological history of the place. The historic records are helpful in filling this knowledge gap.

Base rock layers – or local geological layers – can provide information about soils and the movement of water. Salt Spring and other Gulf Islands are characterised by glaciated ridges and valleys that reflect the geometries of the underlying bedrock formations. The islands are underlain by highly faulted sedimentary rocks of the Nanaimo Group. Groundwater aquifers in the bedrock are important ecologically and as a community water supply, but are poorly understood and difficult to map because they are highly partitioned (often in faults).
*This map’s resolution is low.

The Maxwell Creek watershed is characterised by ridges of erosion-resistant sandstone and conglomerate and lower valleys with eroded materials, such as shales, gravelly sand loam, and colluvial materials and a C-horizon consists of fractured bedrock. The Maxwell farmstead was placed on Suffolk soil, which is characterised as loamy sand.
These features influence the movement of water across the surface and below ground, influencing the pattern of groundwater recharge and the chemical properties of creeks, wetlands and Maxwell Lake.
*This map’s resolution is low.
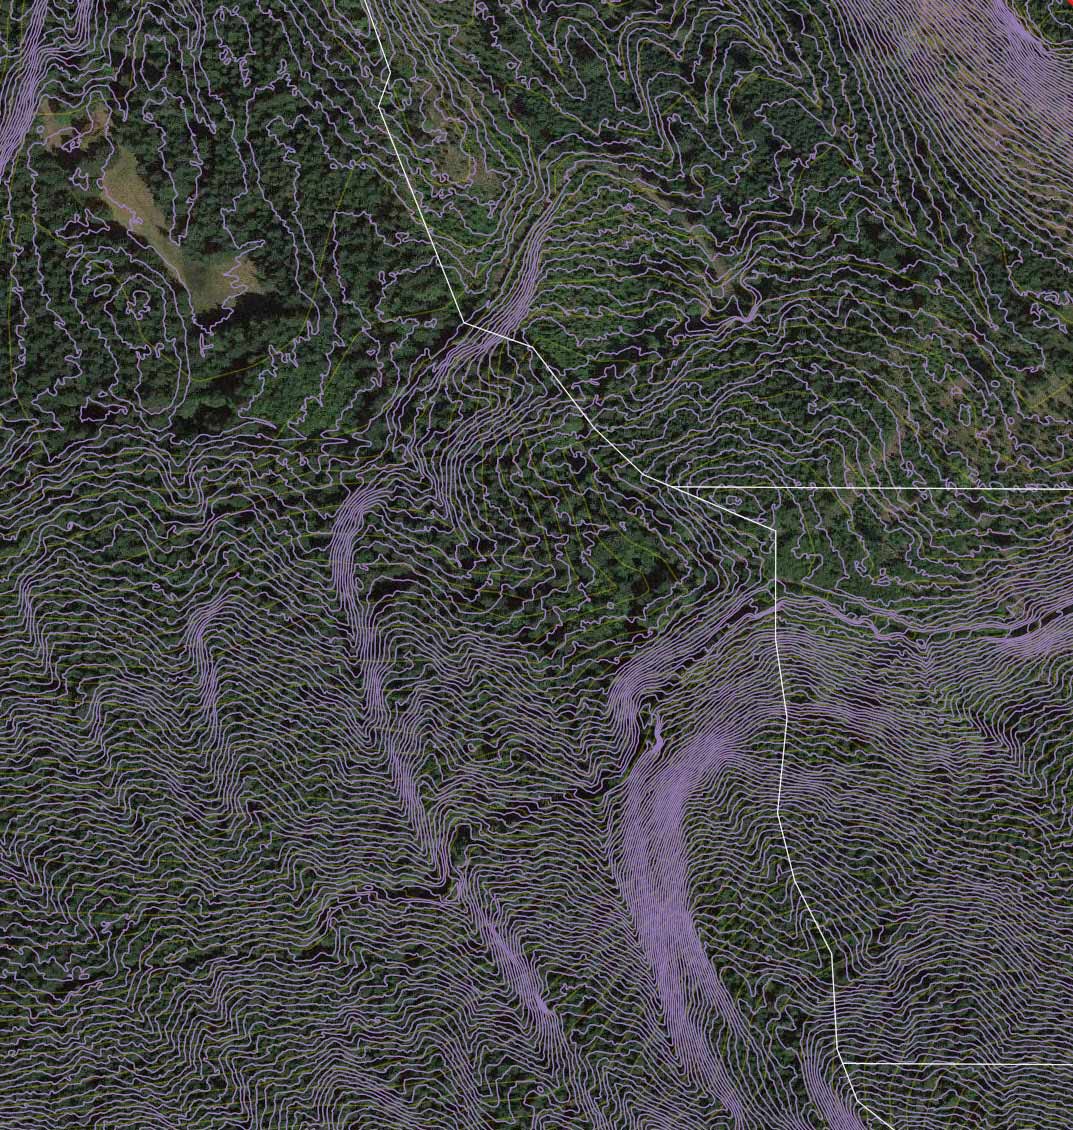
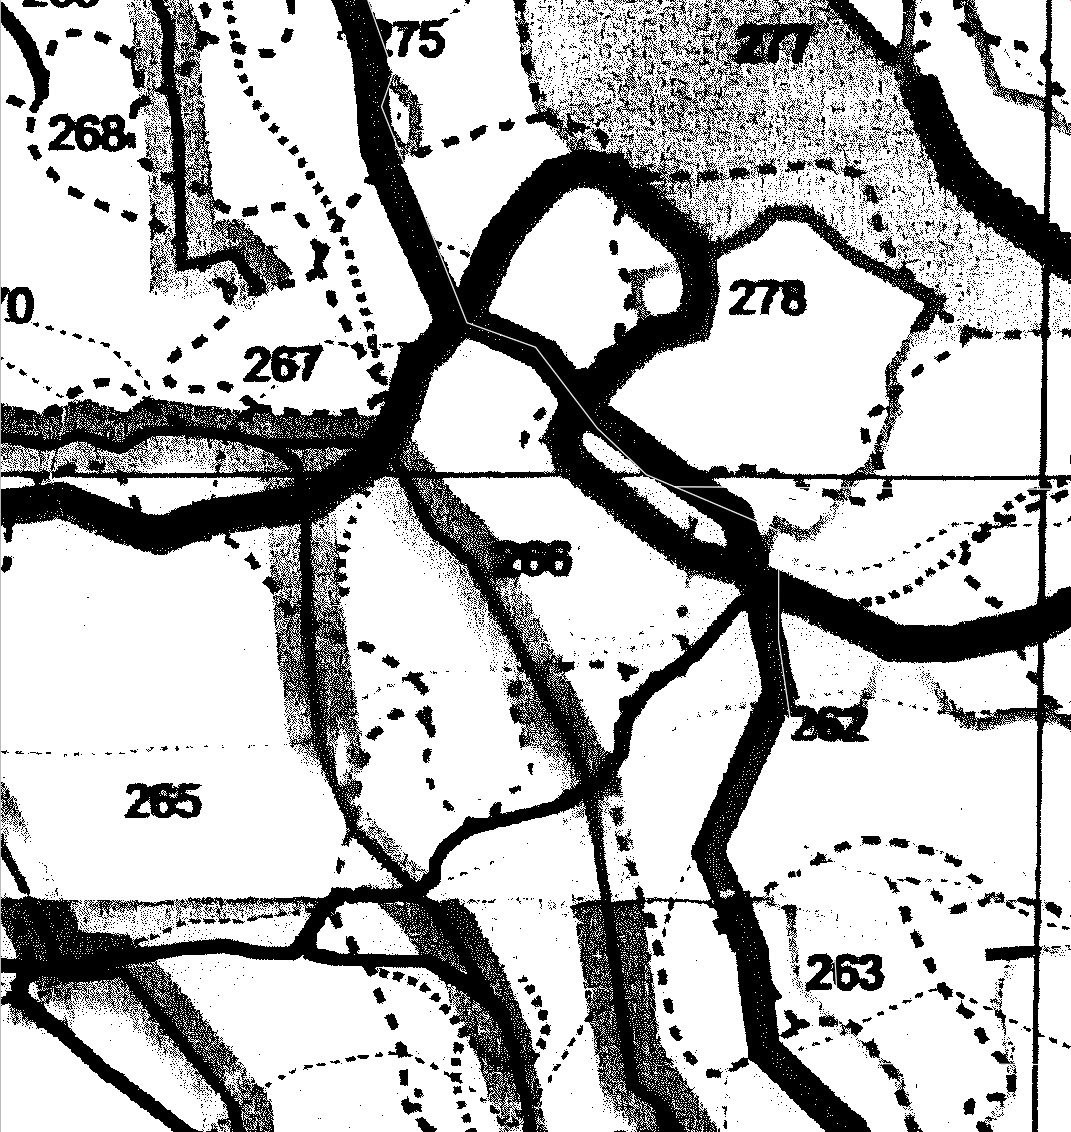
Contour lines show elevation over sea level. Lines that are close together indicate steep slopes, lines that are farther apart indicate gentle slopes. Contour maps are important in the context of the MCWP, influencing surface water flows, water accumulation, and vegetation and tree cover.
The CDF Biogeoclimatic Zone ranges in elevation with ecosystems varying according to aspect, soils, and other biophysical conditions. The topography and ecological niches across the Maxwell Creek Watershed are diverse; ranging from just under 300 m elevation, including valleys, wetlands, rocky ridges and ravines. Maxwell Creek ends at the Stuart Channel just north of Erskin Point (an area of suitable Surf smelt forage and spawning habitat).
Considerations: Contour data is readily accessible and useful for identifying features in the landscape. It is also useful in models seeking to map surface water flows or identify catchment areas.
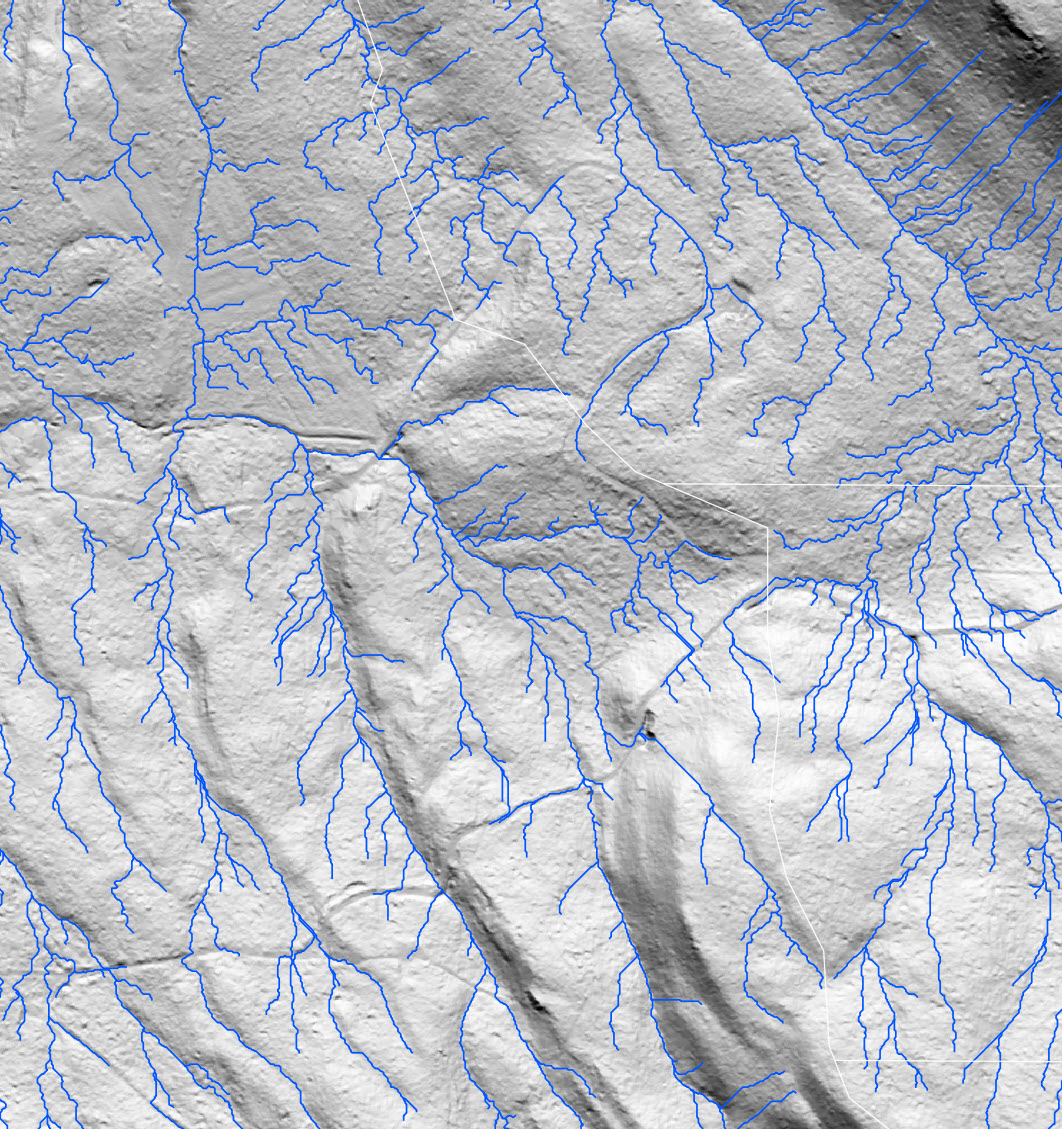
Bare Earth information is used in surface-water modelling to understand how water flows within the watershed. In this map, drainage channels (shown) were derived from surface topography to show overland flow.
The Maxwell farmstead (top left) shows how water has been rerouted using linear features within the fields, and using a trench running east-west immediately south of the farm. These features accelerate water flows and exacerbate flash flooding and erosion. In fact, the trench intercepts and redirects the waters from the upper watershed away from the fields, toward the Maxwell Road – which is experiencing significant erosion and contributing to sediment and nutrient loading into the creek supplying Maxwell lake.

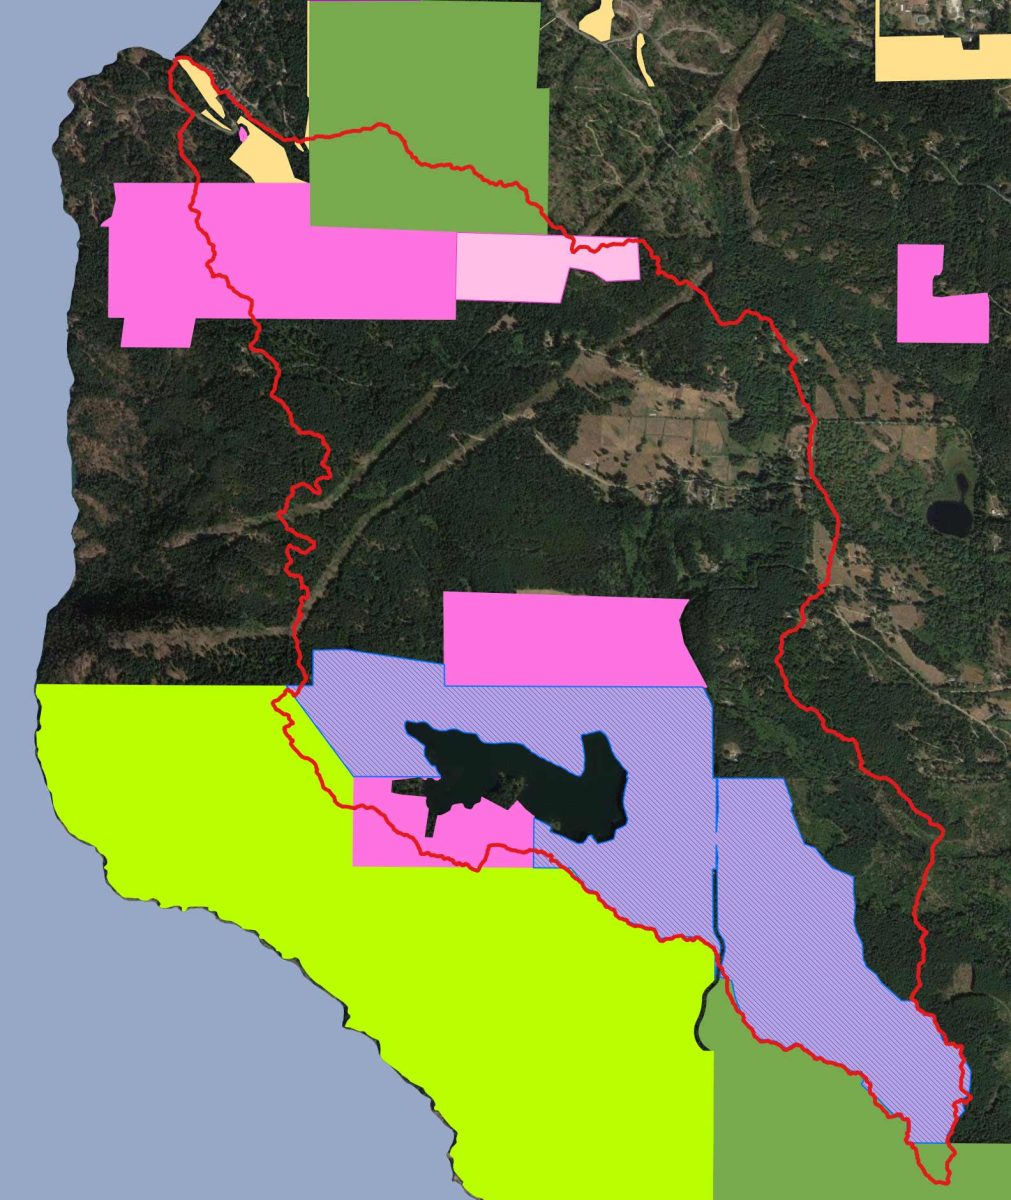
In addition to a large proportion of the land within the Maxwell Creek watershed (outlined in red) being under private ownership as shown in Map 18, there is a blend of different ecological protections in place. The legend below provides more information on the different levels of protection present within the watershed.
• Purple: Watershed Protection land
Land managed by North Salt Spring Waterworks and protected under that management regime. Not protected by any associated regulation or legislation (such as a conservation covenant).
• Dark green: Provincial park
Protected area managed by BC Parks. Though provincial parks have been set aside in an effort to preserve natural environments, recreation is typically prioritised over maintaining ecological integrity.
• Light green: Ecological reserve
Crown lands preserved for ecological purposes. Almost all extractive and disruptive activities are prohibited within ecological reserves making this one of the highest levels of protection available in BC.
• Yellow: Community parks
Generally designated and managed by a local/regional commission for recreational purposes. Most community parks on Salt Spring are managed by the Salt Spring Island Parks and Recreation Commission (PARC).
• Light and dark pink: Conservation land
Land protected by a conservation covenant. These lands are either owned by a local land trust or owned privately, but permissible activities are dictated by a protective covenant registered to a property’s title. A conservation covenant is typically managed by one or two local land trusts who engage in regular monitoring.
Access challenges
There are two major access challenges that might arise in the context of a landscape level project like the MCWP. The first is on-the-ground property access. Maps 18 to 21 were created to illustrate administrative details relating to land ownership and management within the Maxwell Creek watershed. As the maps show, an overlapping matrix of ownership, ecological protections, zoning, and development permissions can be challenging to navigate. In the context of the MCWP, it has meant that multiple collaborative partnerships had to be established prior to beginning an on-the-ground work. These partnerships will need to be maintained throughout the project’s lifetime via regular communications and permitting processes.

Zoning is a land planning tool, typically available to local governance structures including municipalities and in the case of the MCWP study area, the Islands Trust. Zoning bylaws regulate how land is allowed to be used. In the case of the Maxwell Creek Watershed, there is a blend of zoning types (all labels typed in black text):
A: Agricultural
F: Forestry PR: Parks & Reserves
R: Rural R1-12: Residential
RU: Rural Uplands
RW: Rural Watershed
S: Shoreline
This information is important to delineate areas to be included in the study. It can also help to improve understanding of historical land use and determine whether proposed restoration activities will be permitted.
Local governing bodies can employ the use of a DPA to specify that certain locations require special treatment when under development consideration. That is, special requirements and guidelines are in effect for any development or alteration of the land within the specified area. This can include protection of ecologically sensitive areas, avoiding certain hazards (e.g. steep slopes), and maintaining specific form or character, among many other things. Ultimately, locations falling under a DPA require specific permissions prior to undertaking any activity and thus can limit the types of activities that may be allowed.
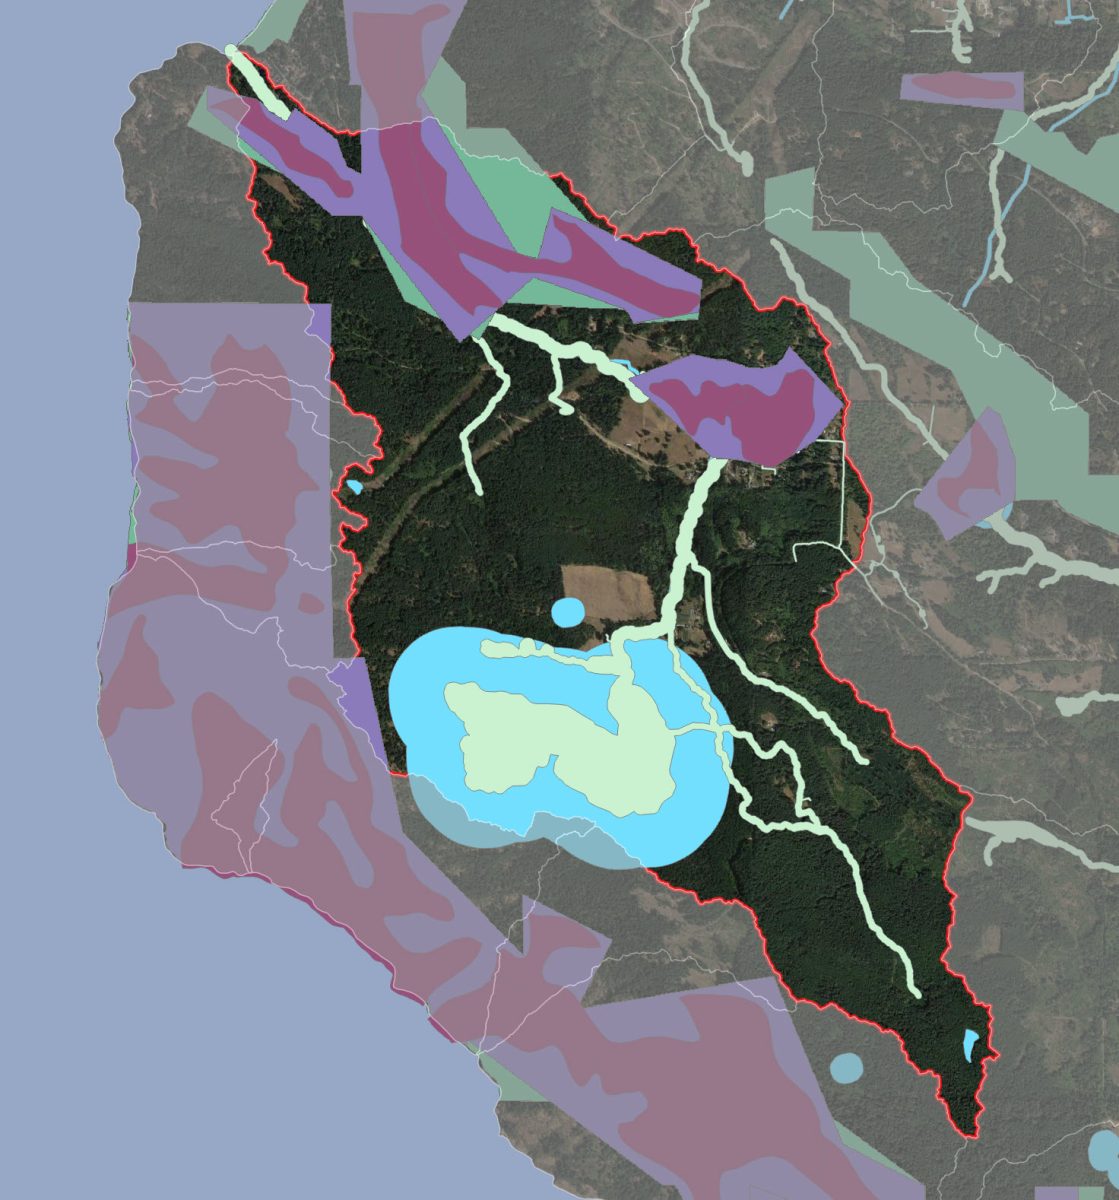
The MCWP area falls under two DPAs as outlined by the Salt Spring Island Official Community Plan. The first is DPA 4 Lakes, Streams, and Wetlands, which is identified in blue on Map 21. This DPA is intended to protect 10 metres horizontally from the natural boundary of streams, 300 m horizontally from the natural boundary of Maxwell Lake and within 61 m of other lakes. The second is DPA 7 Riparian Areas, identified in light green on Map 21.
The other major accessibility issue for a project like this is typically data access. Because of the multi-jurisdictional landscape, with a variety of historical land-uses ranging from industrial (e.g. forestry) to protective (e.g. ecological reserves), there are multiple datasets available with different owners. Luckily, many of these datasets have been compiled and made publicly available to anyone with interest in seeking them out. Some of the datasets used to create the maps in question were accessed through the following websites: