Backgrounder: The 2019 fishery and endangered Fraser Chinook
Although fisheries closures in 2019 disrupted some recreational fisheries, the closures did not meet the goal of keeping endangered Chinook mortality below 5 per cent.
This backgrounder on endangered Fraser Chinook has been produced by Raincoast Conservation Foundation, David Suzuki Foundation, and Watershed Watch.
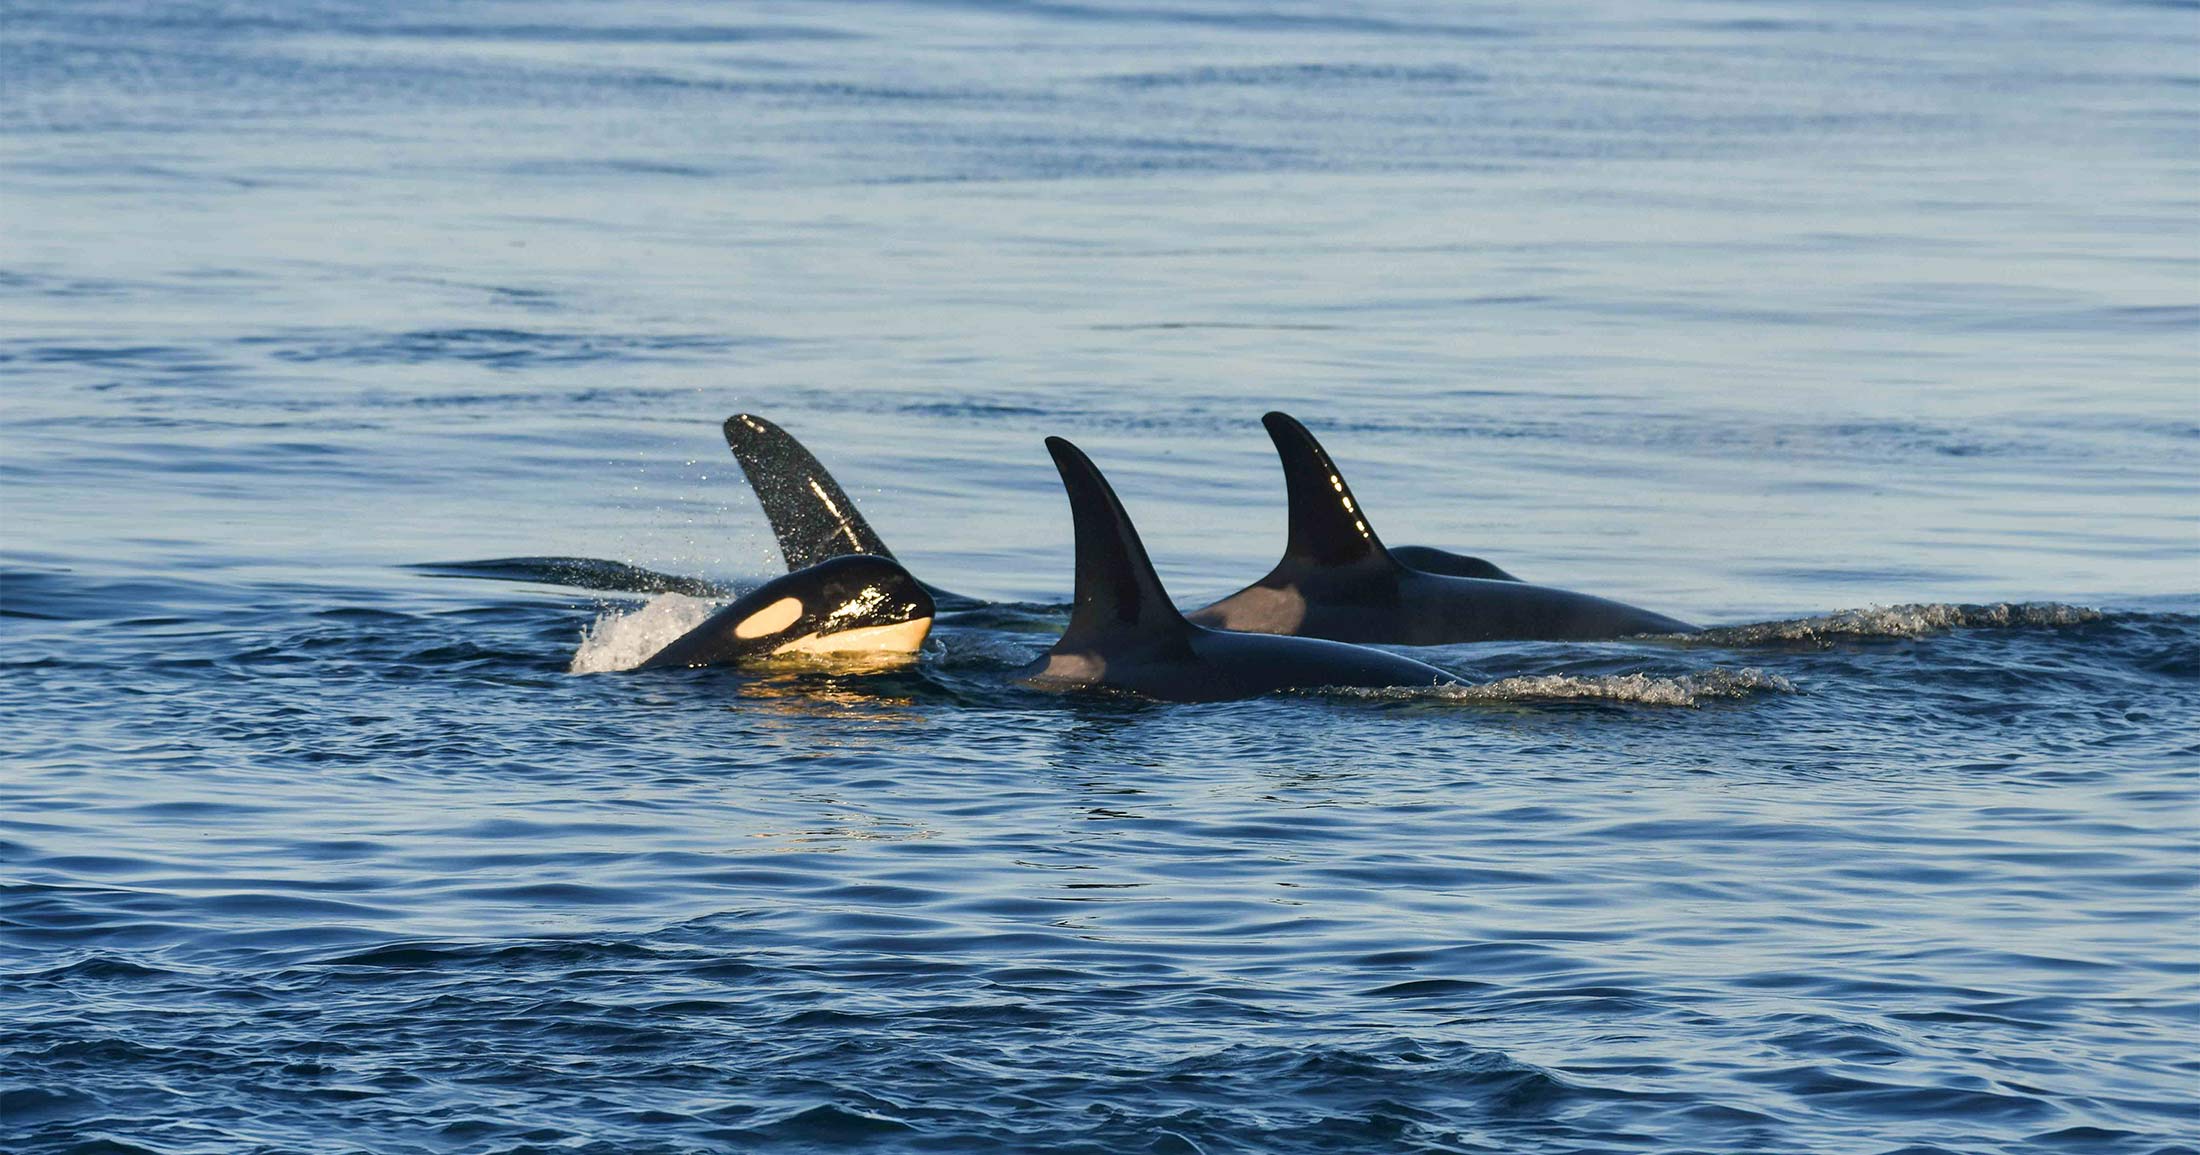
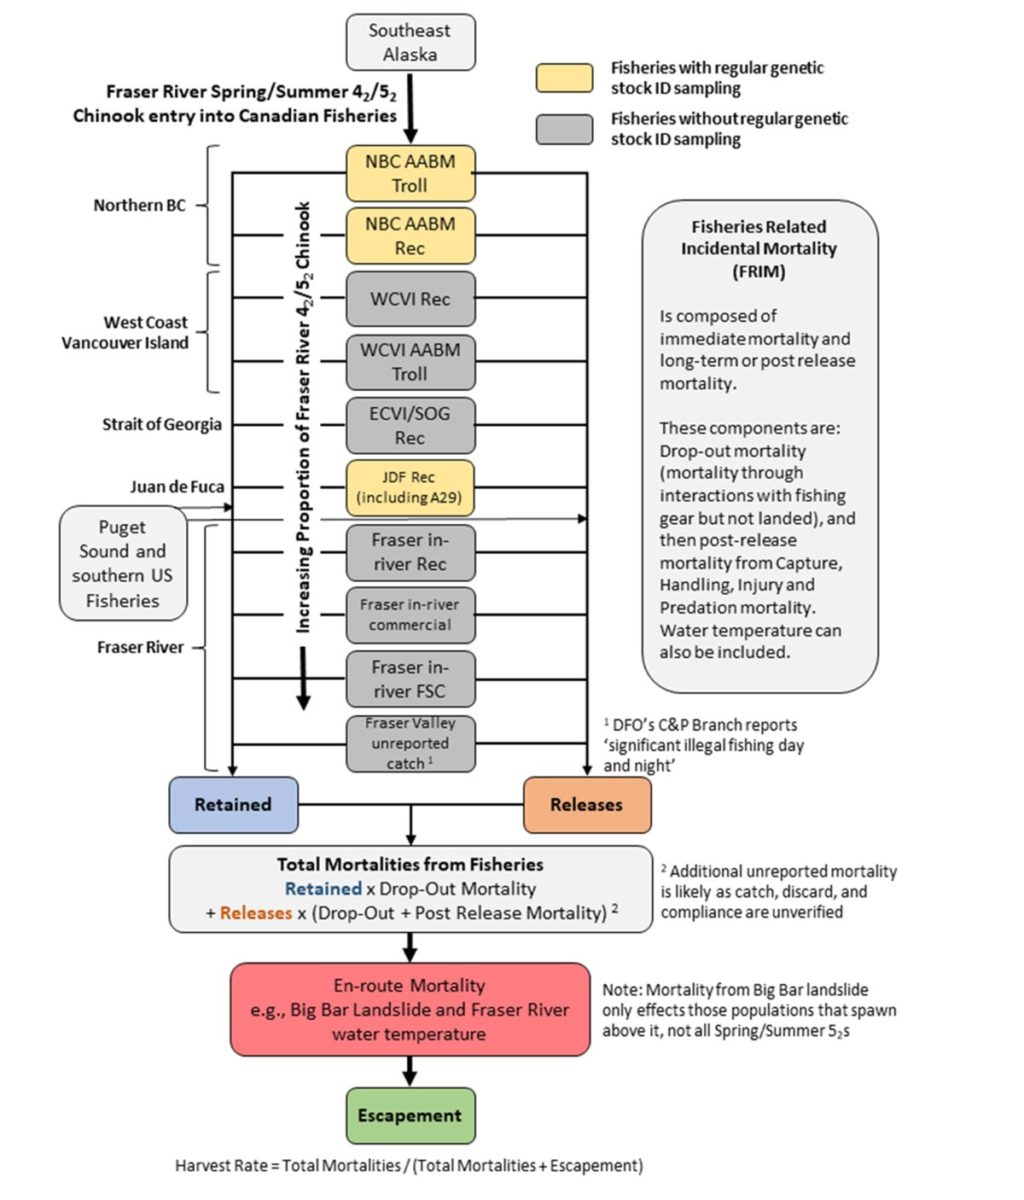
In 2018, the Committee on the Status of Endangered Wildlife in Canada (COSEWIC) identified 11 populations of spring and summer stream-type Chinook (called 42 and 52 for four- and five-year-old fish, with the “2” describing their migration to the ocean in their second year) as threatened or endangered (Figure 4). As the largest and oldest Chinook that return to the Fraser River, these fish play a significant role in the diets of endangered Southern Resident killer whales and as a source of food for interior First Nations. The likely causes for their endangered status are habitat loss, fishing pressure, potential prey competition, and changing marine conditions associated with climate change.
In 2019, the Fisheries Minister committed to protect endangered spring and summer (42 and 52) Fraser Chinook by limiting mortality in Canadian fisheries to 5%. After the 2019 season, B.C. conservation groups analyzed the Department of Fisheries and Oceans’ (DFO) fisheries data and concluded the target was exceeded, likely by many times. It is difficult to quantify exactly how far the 5% objective was exceeded due to the lack of data in most of the fisheries that catch these fish. An estimated 4,000 endangered Chinook died in just three (out of 10) fisheries.
Although fisheries closures in 2019 disrupted some recreational fisheries, the closures did not meet the goal of keeping endangered Chinook mortality below 5 per cent. South coast recreational fisheries still occurred from April to August releasing 116,000 Chinook and capturing and killing 49,164 Chinook. Endangered chinook died in these fisheries.
On the south coast (all areas and times), including when endangered Chinook salmon were present, the recreational industry saw its catch increase to 392,506 chinook over the 2014 – 2018 average of 328,567 chinook, an increase of 16%. Of these, 236,770 chinook were released, a percentage of these discarded fish would not have survived to reach their spawning grounds.
Based on DFO’s estimate of 30,000-35,000 stream type Chinook reaching the lower Fraser River, a maximum mortality of 5% would allow 1,600 to 1,800 Chinook to die in all fisheries (kept, released and illegal catches). There were 10 Canadian fisheries in 2019 that could encounter endangered Chinook, but mortality estimates can only be made for three because of DFO’s lack of monitoring and assessments.
The three marine fisheries that had enough data for analysis were: North Coast (recreation and commercial), and the Strait of Juan de Fuca (extending from Swiftsure through Victoria, the Gulf Islands and the mouth of the Fraser River). Our estimates indicate that around 600 early Fraser Chinook were killed in North Coast recreational and North Coast commercial troll fisheries in 2019. Another 3,500 likely died in recreational fisheries from Juan de Fuca through to the mouth of the Fraser River from a combination of both retention and release mortality. If total mortalities from all 10 fisheries could be included, estimates of the number of endangered Chinook killed in Canadian fisheries would be much higher than the approximately 4,000 that can be accounted for in these 3 fisheries.
The number of Fraser River 42 and 52 Chinook that reached their spawning grounds was approximately 14,500. Fishing related mortalities of more than 4,000 endangered Chinook in the South Coast and North Coast recreational fisheries and North Coast commercial fisheries is a consequence of a management plan that allows for significant fishing effort in times and areas where endangered Chinook are known to be present. If these fish were not killed, it is possible that escapements would have increased by 28% above the 14,500 that reached their spawning grounds.
Calculation of mortality
Calculation of mortality in the West Coast Vancouver Island, Juan de Fuca, Sooke/Victoria, Gulf Islands, and Fraser River marine area recreational fisheries from April through August 2019:
- Numbers of retained and released catch were obtained from DFO for April through October for recreational fisheries from the Strait of Juan de Fuca through the Gulf Islands to the mouth of the Fraser River. This region corresponds to Fisheries Management Areas 121, 18, 19, 20 and 29 and overlaps with critical foraging areas for Southern Resident Killer Whales. These same Chinook are an important food source for the whales.
- DNA proportions assigned to both the kept and released catch were based on the average composition of Fraser 42 and 52 Chinook present in the 2009, 2010, 2014, 2016, 2017, and 2018 retained catch in the above areas. There is considerable variation between years, and this adds to the uncertainty in estimates.
- The DNA samples collected between 2009 and 2018 were taken only from retained catch. During these fisheries, regulations required the release of larger (potentially Fraser) Chinook. Non-retention regulations for these larger fish would mean the Fraser DNA results from retained fish underestimate of the proportion of Fraser 42 and 52 in discards (which are not sampled).
The proportion of DNA in the retained catch between 2009 and 2018 was applied to both 2019 released fish and retained catch in the study areas that occurred during April, May, June, July, August and September. - Estimating mortality in the released catch is the sum of:
- Fishery Related Incidental Mortality (FRIM), an estimate of the proportion of fish that were released, or escaped, from fisheries and didn’t survive to spawn,
- Misreporting and under-reporting,
- Non-compliance.
- Our analysis employs an estimate of 37% for Fishery Related Incidental Mortalities (FRIM). These mortality estimates come from DFO’s Science Advice (i.e. SAR 2016 and Patterson et al. 2017b); the 37% may be conservative, as it does not incorporate estimates for re-capture mortality, misreporting or non-compliance. However, the absence of independent monitoring of fisheries, catch, and compliance, along with the failure to follow the guidance of DFO’s own Science Advice (i.e. DFO (2016) and Patterson et al. (2017b)) makes it difficult to evaluate these issues. We make no effort to incorporate estimates for misreporting, under-reporting, or non-compliance.
- An estimated 4,273 Fraser 42 and 52 Chinook were released and another 1,800 Fraser Chinook were retained between April and September in the South coast recreational fishery study area. Figures 1 and 2 show the different estimates for total mortalities when applying:
- DFO methods,
- Pacific Salmon Commission (Chinook Technical Committee) methods, and
- our methods that apply CSAS Science Advice Report (SAR) and Paterson et al. 2017a/b, to the released catch.
Conserving threatened and endangered Chinook
- Recovery of endangered 42 and 52 Fraser Chinook requires ensuring as many Chinook from these populations (Conservation Units) reach their spawning grounds as possible, as each returning Chinook is a reservoir of critical genetic material.
- The Big Bar landslide had a severe effect on 52 Spring and Summer Conservation Units. Every effort must be made to ensure as many 52 Spring and Summer populations make it to their spawning grounds as possible.
- There are some sources of fishing mortality, like the illegal Fraser Valley fishing, which appear to be beyond DFO’s ability to monitor or control. The potential loss accrued in these fisheries must be taken into consideration when planning any other fisheries.
- Freshwater environmental conditions are known to affect sockeye migration. The Pacific Salmon Commission has responded by reducing catch and increasing the number of sockeye that need to pass through fisheries. The same has not been done for Chinook, even though they are migrating at approximately the same time as Early Stuart and Early Summer sockeye. Further, research has shown that fish dropped out or discarded from fisheries experience more stress in elevated water temperatures.
- DFO does not have the required catch, discard, compliance, FRIM, or genetic monitoring in place to support a fishery that has a total mortality cap on endangered populations.

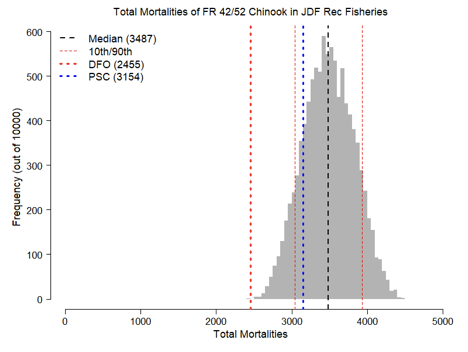
Notes on Figure 3
The first dotted vertical red line shows mortality estimates using DFO methodology. DFO does not include all sources of mortality and does not include FRIM when reporting total mortalities. The second blue vertical dotted line is the estimate of total mortalities using the Pacific Salmon Commission Chinook Technical Committee methodology. The PSC CTC acknowledges that their methodology does not include all sources of potential FRIM, but they do include drop-out mortality.
The vertical black dotted line is the median of the Total Mortality estimate (point estimate) using CSAS Science Advice Report (SAR) methodology. The probability distribution (grey area) is our estimation of the range of possible mortalities using the 2016 CSAS SAR and Paterson et al. (2017a/b) methodology and appropriate risk factor ranges.
Importantly, this figure and calculation do not incorporate estimates for misreporting of retained catch or discards, or non-compliance.

About COSEWIC
The Committee on the Status of Endangered Wildlife in Canada (COSEWIC) determines the status of Canada’s threatened, endangered or at-risk species (mammals, fish, birds, plants and more) including subspecies, populations, conservation units or other designatable units. COSEWIC uses a scientific process as well as Aboriginal or community knowledge to assess wildlife.
Literature Cited
DFO. 2016. Science Advice Report. Review and Evaluation of Fishing-Related Incidental Mortality for Pacific Salmon. DFO Can. Sci. Advice. Sec. 2016/049.
Patterson et al. 2017a. Review and Evaluation of Fishing-Related Incidental Mortality for Pacific Salmon. DFO Can. Sci. Advis. Sec. Res. Doc. 2017/010. ix + 155 p.
Patterson et al. 2017b. Guidance to Derive and Update Fishing-Related Incidental Mortality Rates for Pacific Salmon. DFO Can. Sci. Advis. Sec. Res. Doc. 2017/011. vii + 56 p.
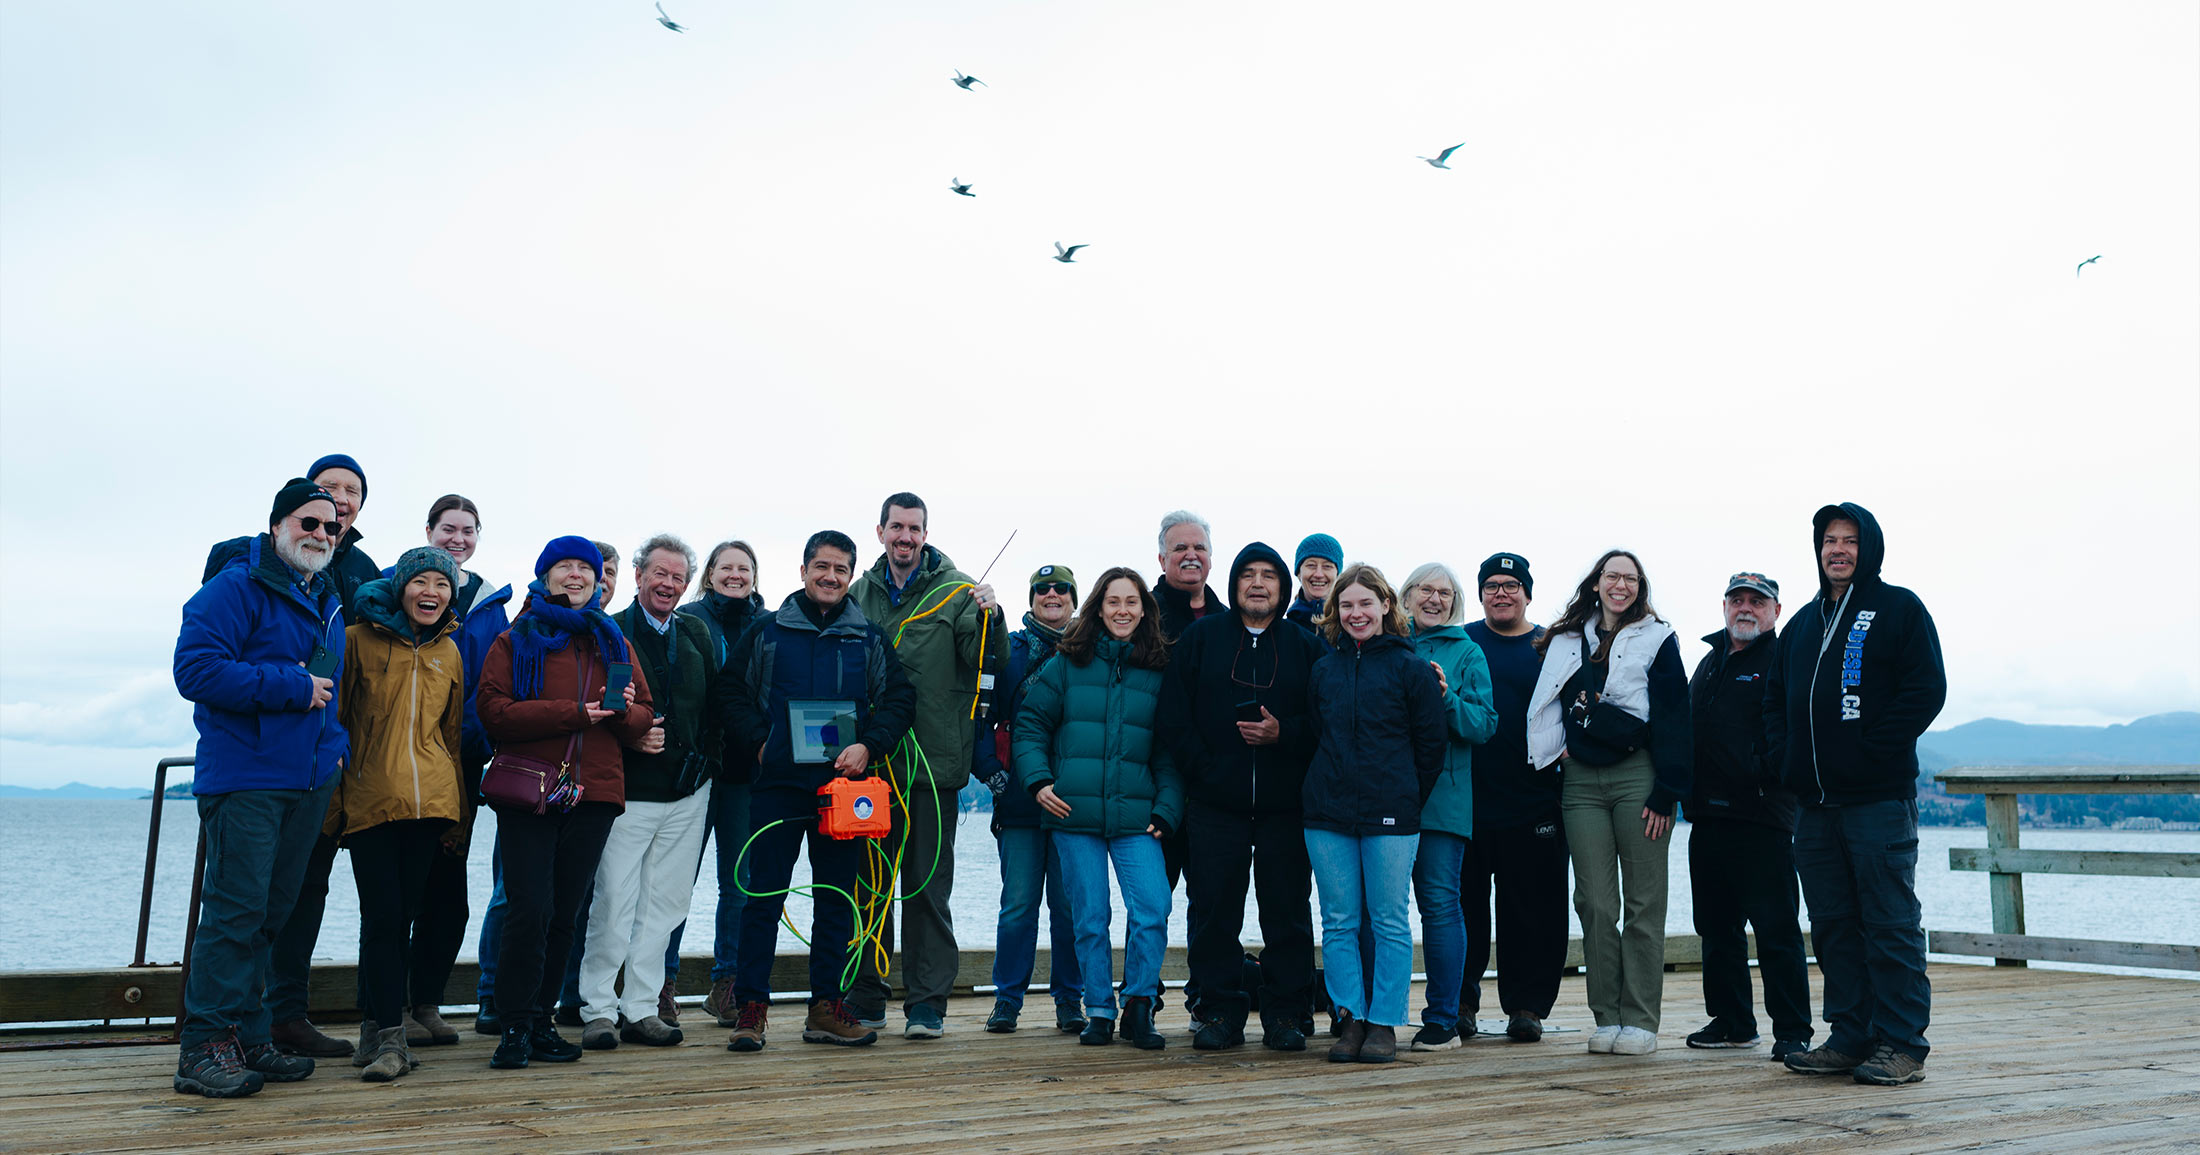
Support our mobile lab, Tracker!
Our new mobile lab will enable the Healthy Waters Program to deliver capacity, learning, and training to watershed-based communities. We need your support to convert the vehicle and equip it with lab instrumentation. This will allow us to deliver insight into pollutants of concern in local watersheds, and contribute to solution-oriented practices that protect and restore fish habitat.