What is a watershed?
How can we use the movement of water through the landscape to inform our understanding of water quality?
A drop of water plummets out of a dark grey blanket of cumulonimbus gathered around the craggy peak of a mountain.
As it falls, it is pushed by wind. Thermal upwellings might slow its descent as gravity drags it down towards the mountain top.
Where this drop of water lands, on which side of the peak, along which ridgeline, into which crevice of rock, will determine its future path – what bodies of water it will join, and ultimately its destination.
The path of least resistance
It is often remarked that water follows the path of least resistance. Scientifically speaking, this is not a precise description of the ways in which water moves through the environment.
Like many other natural systems, there is much complexity and nuance to how topography, geology, substrate density, water volume, and physics work together to determine the path a river will carve through a hillside. However, for our purposes, we can consider this basic concept instructive. At Healthy Waters, we explore the intricacies of contaminant analysis, and numerous related topics. We aim here to answer some of the more basic questions: Where does water go? How does it move through the landscape? In short: what IS a watershed?
The water cycle
Most of us have a basic understanding of the water cycle. Clouds condense and water falls to the earth as rain or snow. This water runs down the sides of mountains in streams and creeks, is taken up by plants and animals, and is passed back down into waterways until it reaches the ocean. Water then evaporates into the air in the form of vapour, which eventually condenses to form clouds once more.
Rinse and repeat.
There are, of course, intricacies herein: some water percolates through the soil to be captured in underground aquifers; some water is bottled and sits on shelves in the store (an apparent respite from the cycle until it is ultimately consumed and re-introduced later in time); some water is pumped into drinking water treatment facilities and is delivered to our homes to fill our sinks, bathtubs and toilets.
We can imagine the ways in which water travels across the earth by crafting maps. These maps can illustrate how the geography of the landscape directs the movement down into specific waterways, then to a shared common outlet into marine waters.
It can be helpful to see this from the bird’s eye view.
Mapping a watershed
Watershed boundaries are the upslope areas that collect water, which then flows downhill to a common drainage point. Watersheds vary in size, and can have smaller sub-basins within them. To map a watershed, a model can be created that uses elevation data to predict where water will flow. Elevation data is made up of cells, and models can calculate the flow direction (which direction water will flow from any given cell) and flow accumulation (how many cells flow into each cell). Outlets are the common drainage points where water flows out of a watershed; these outlets are at the lowest point of elevation within a watershed. Using a watershed model, one can select a desired outlet point to delineate the upslope areas where water flows into that specific point, thus creating a watershed.
These maps allow us to visualize the scope of the area that drains into salmon bearing waterways, and gain an understanding of the land-based activities that could be impacting water quality in a given body of water. The borders of a watershed are delineated by elevations chosen by mapmakers to communicate a given purpose. For example, approximately 25% of the landmass that makes up the province of British Columbia falls within the Fraser River watershed. This area is also home to approximately 60% of BC’s population, or 2.7 million people. However, the Fraser watershed is commonly divided into between five and twelve sub-basins, named for the larger tributaries of the Fraser and their surrounding area.
Smaller-scale investigations
At times there is utility in discussing this large watershed as a whole – but when we talk about risks to water quality, there are a number of localized activities such as industrial operations, mining, forestry management, and agriculture (among others) that can contribute contaminants into specific regions (sub-basins) or tributaries of the Fraser River. By looking at land-use activities within these smaller regions, we can more accurately assess the impacts to the system as a whole. One of the core principles of toxicology – “the dose makes the poison” – applies here. Smaller tributaries are more susceptible to environmental disaster as a result of pollutant exposure, specifically because they contain less water to dilute these pollutants which increases the risk to aquatic organisms that inhabit these habitats.
Healthy Waters for all
Our Healthy Waters Program is designed to look more closely at water quality within these smaller watersheds across British Columbia. By utilizing a watershed based approach we can look at how water quality changes as a river moves through the landscape.
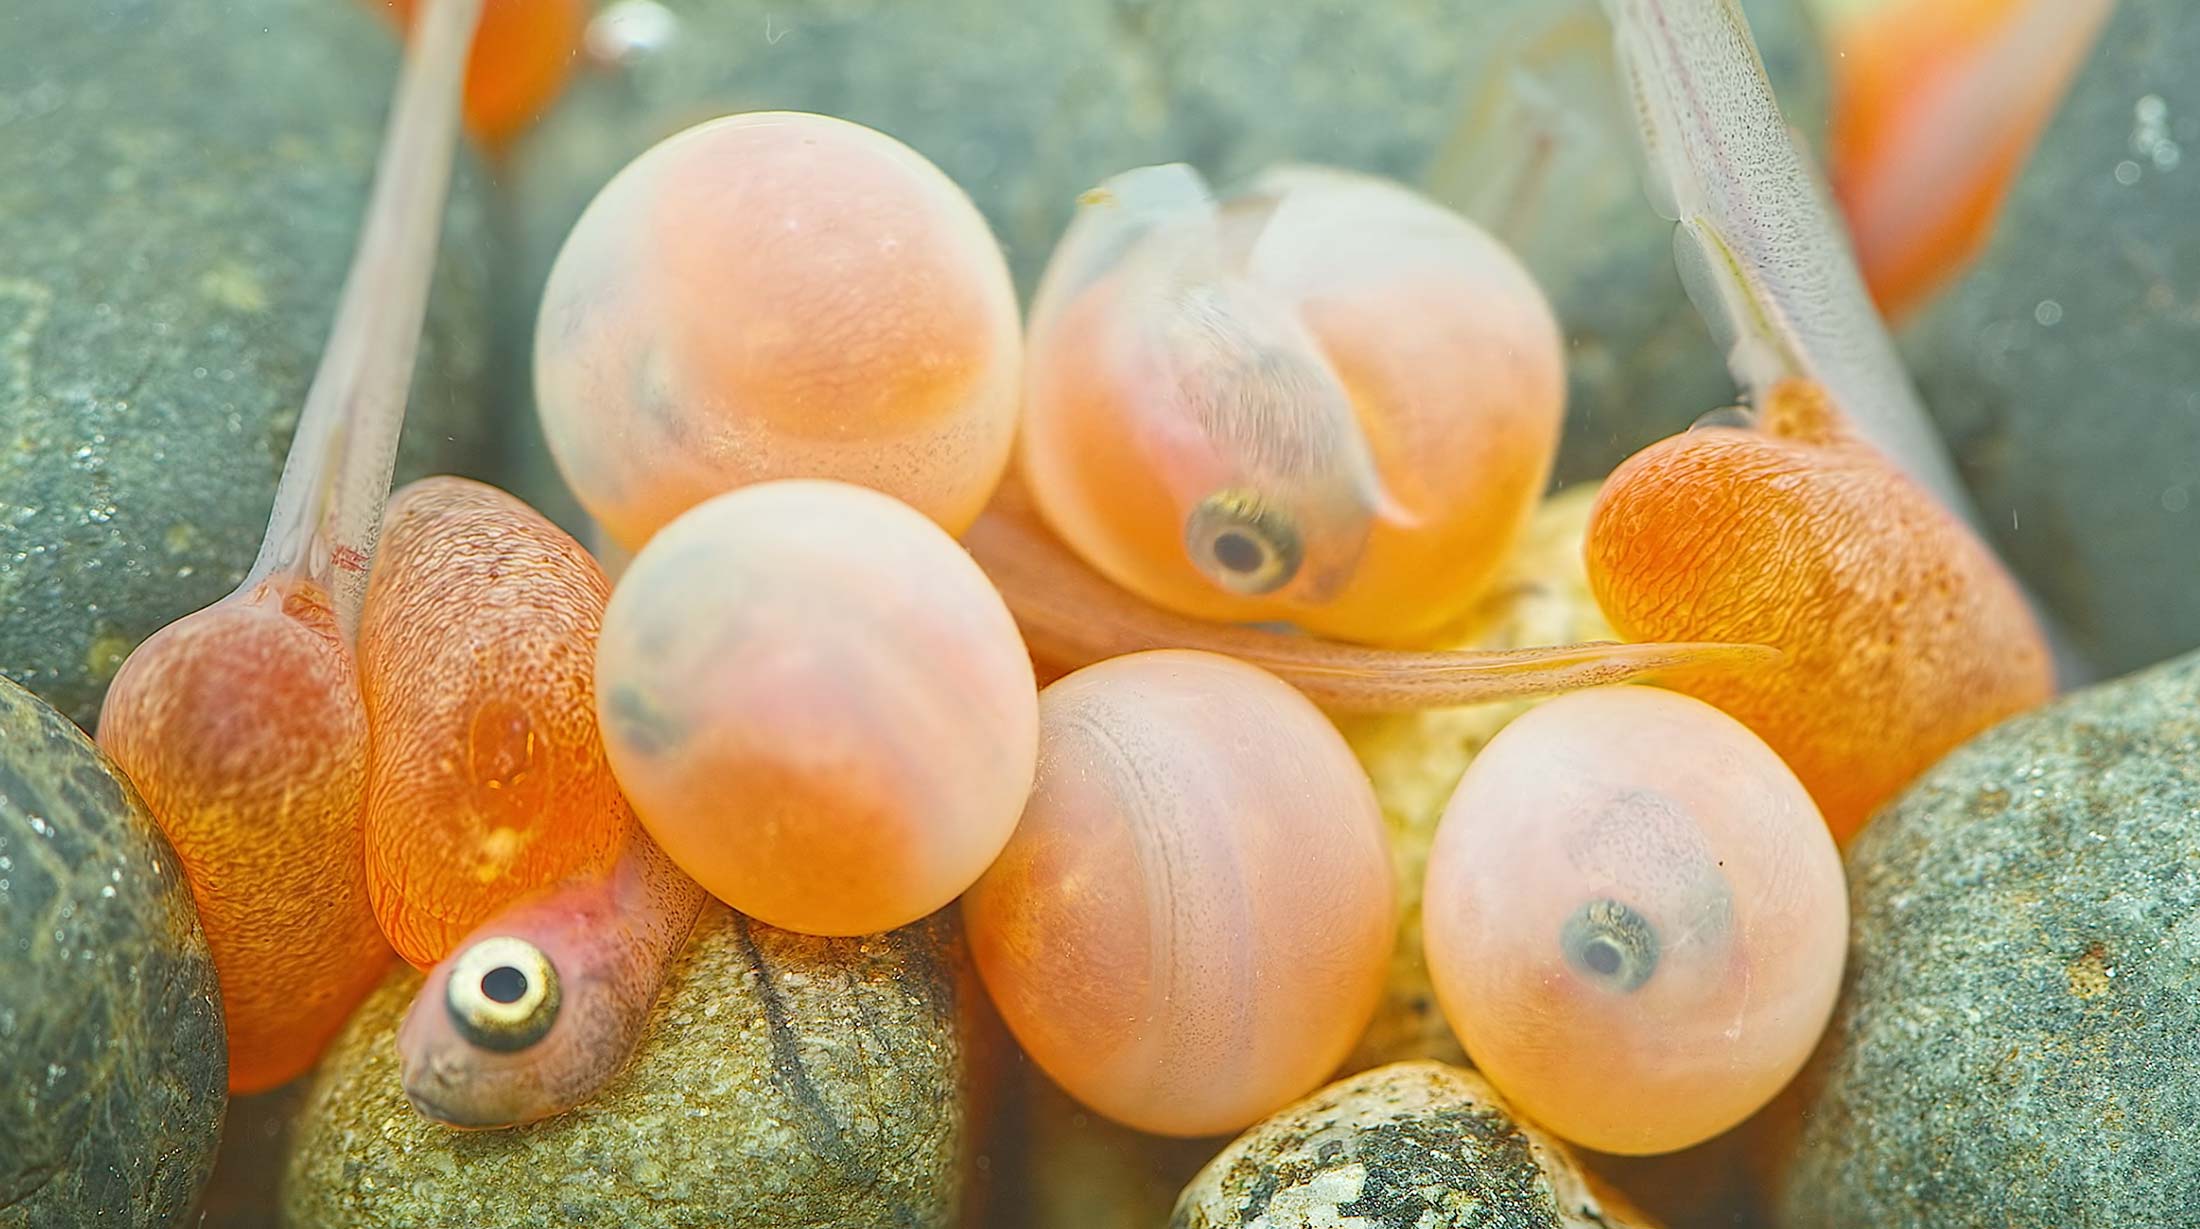
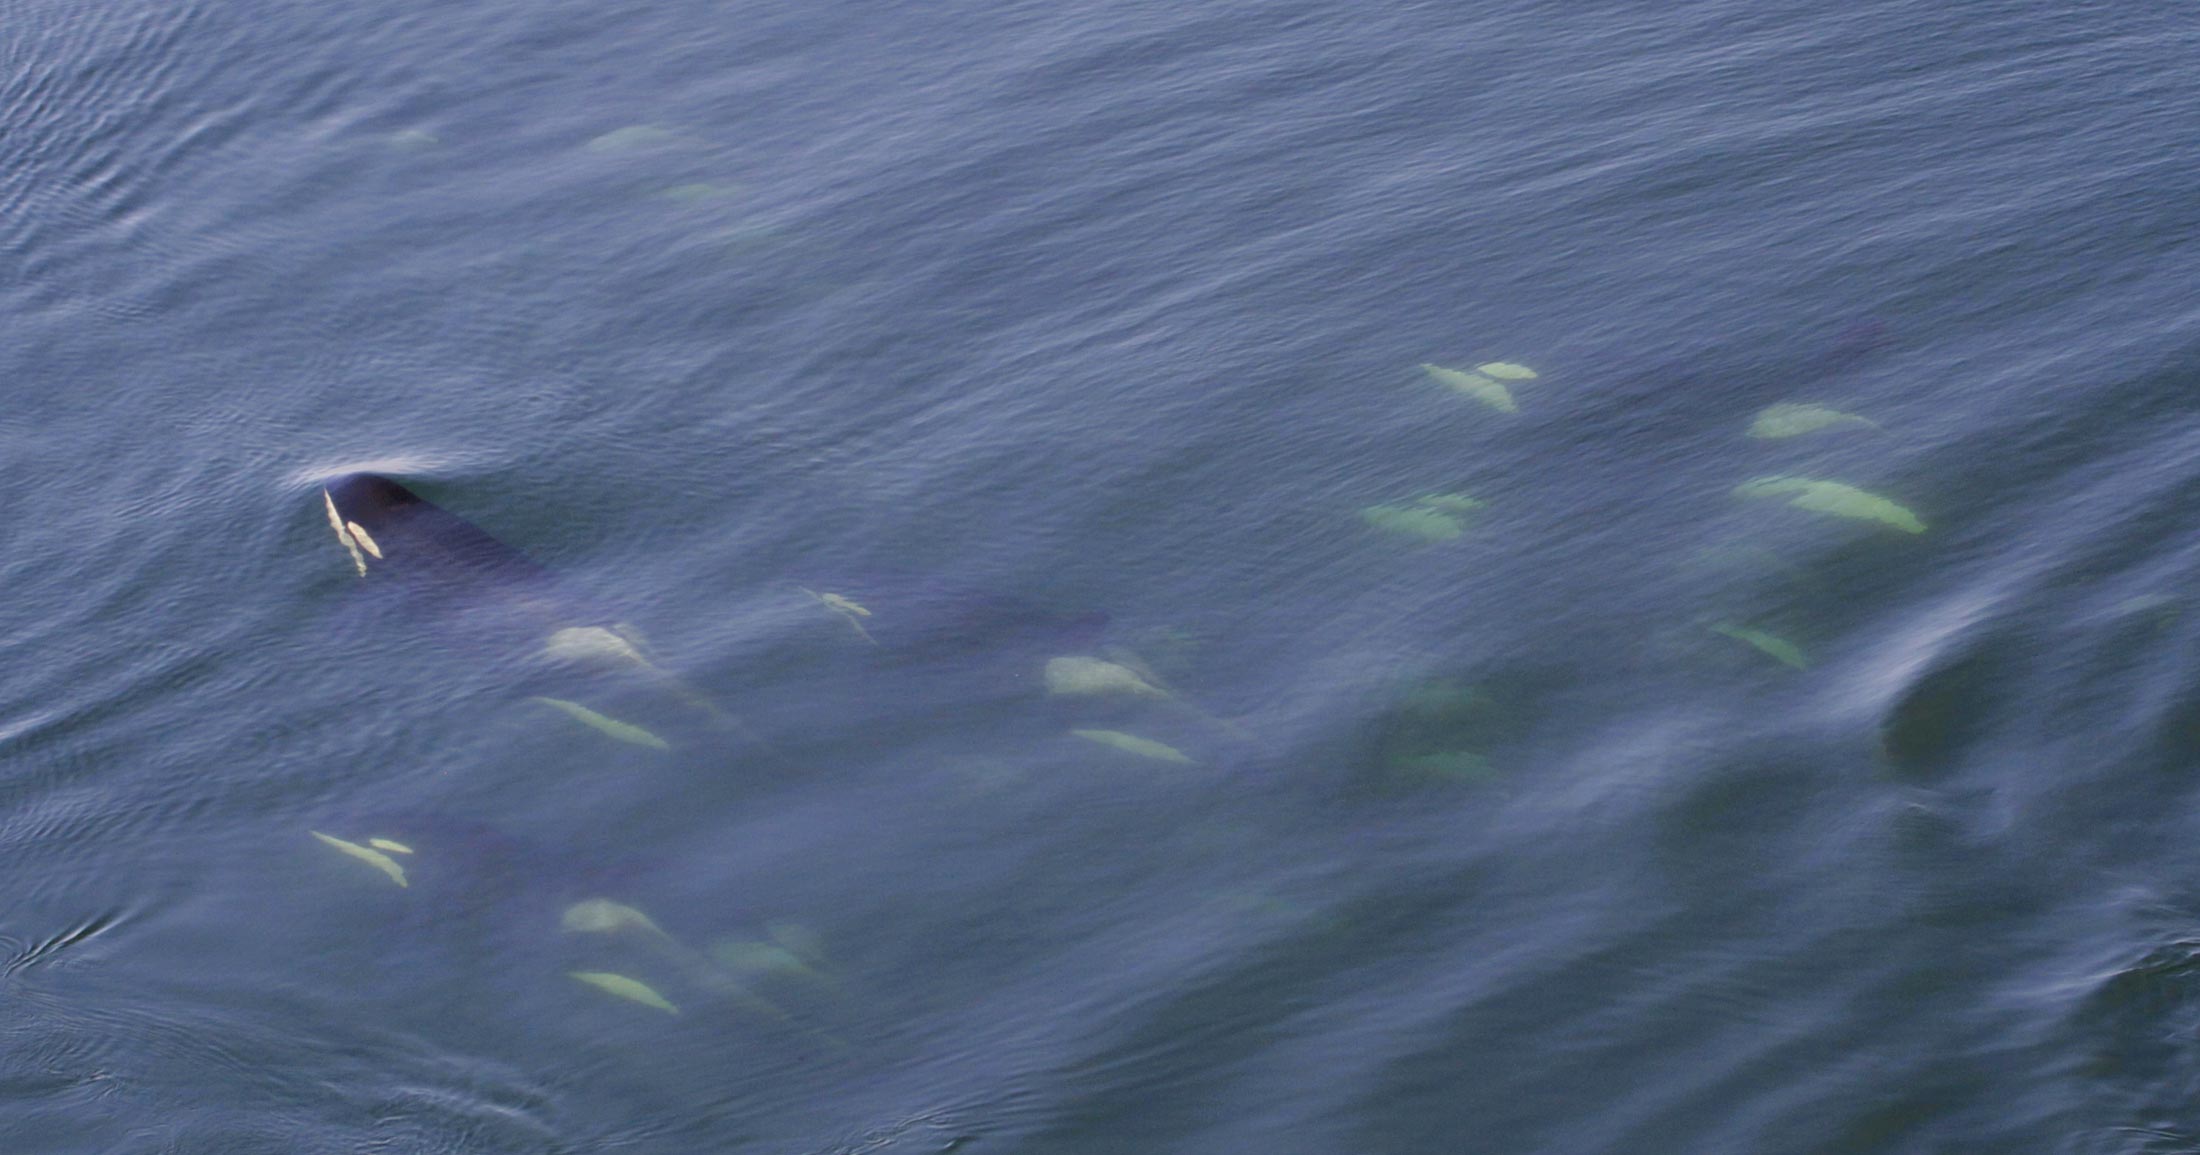
Lessons we learn in our Healthy Waters watersheds can help to inform best practices that can protect and restore this precious resource. Water that is degraded by human activities can spell trouble for salmon, whales, and people.

You can help
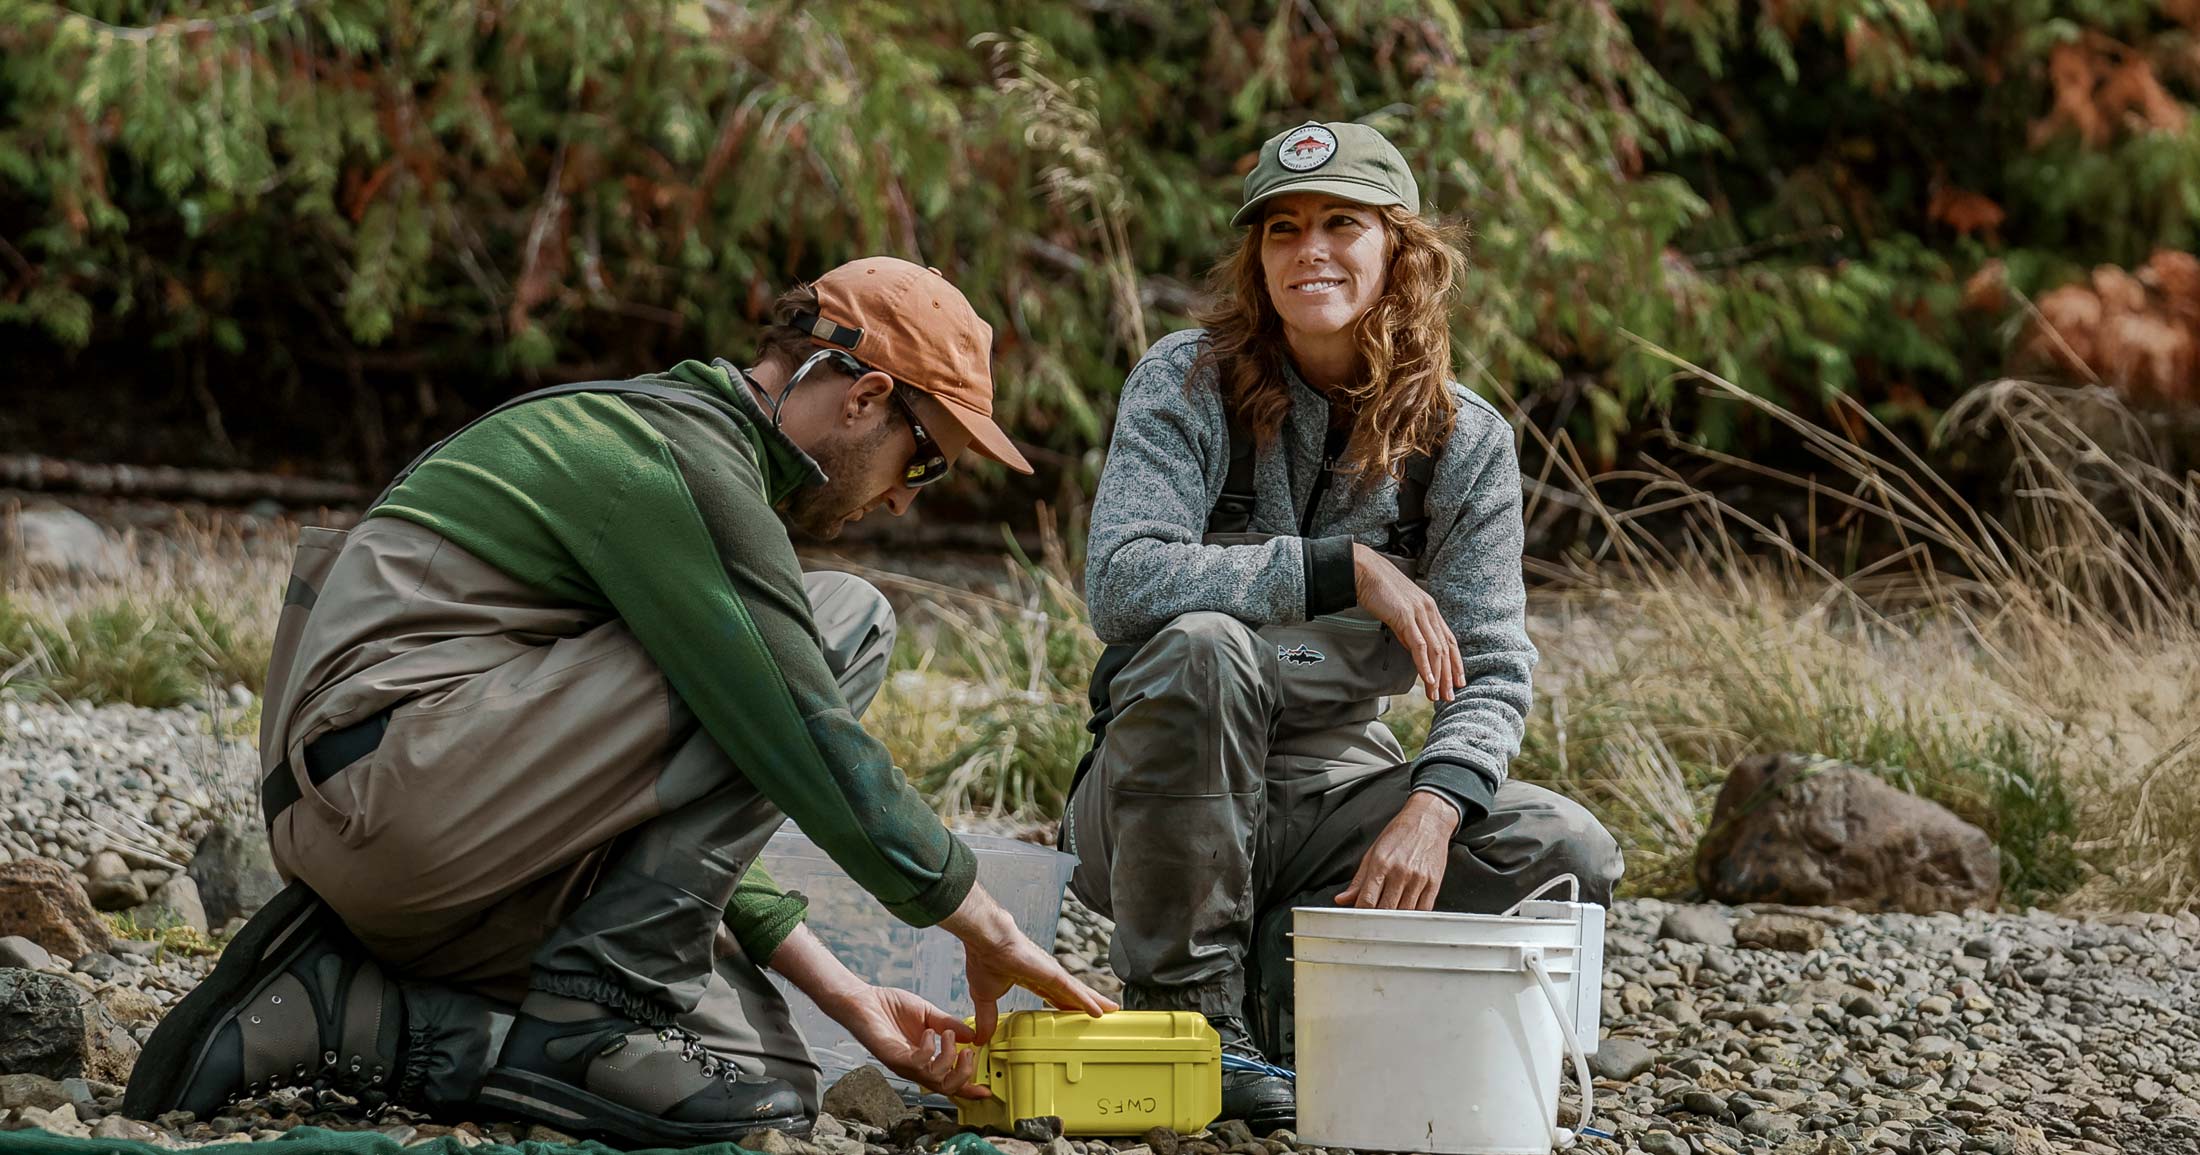
Raincoast’s in-house scientists, collaborating graduate students, postdoctoral fellows, and professors make us unique among conservation groups. We work with First Nations, academic institutions, government, and other NGOs to build support and inform decisions that protect aquatic and terrestrial ecosystems, and the wildlife that depend on them. We conduct ethically applied, process-oriented, and hypothesis-driven research that has immediate and relevant utility for conservation deliberations and the collective body of scientific knowledge.
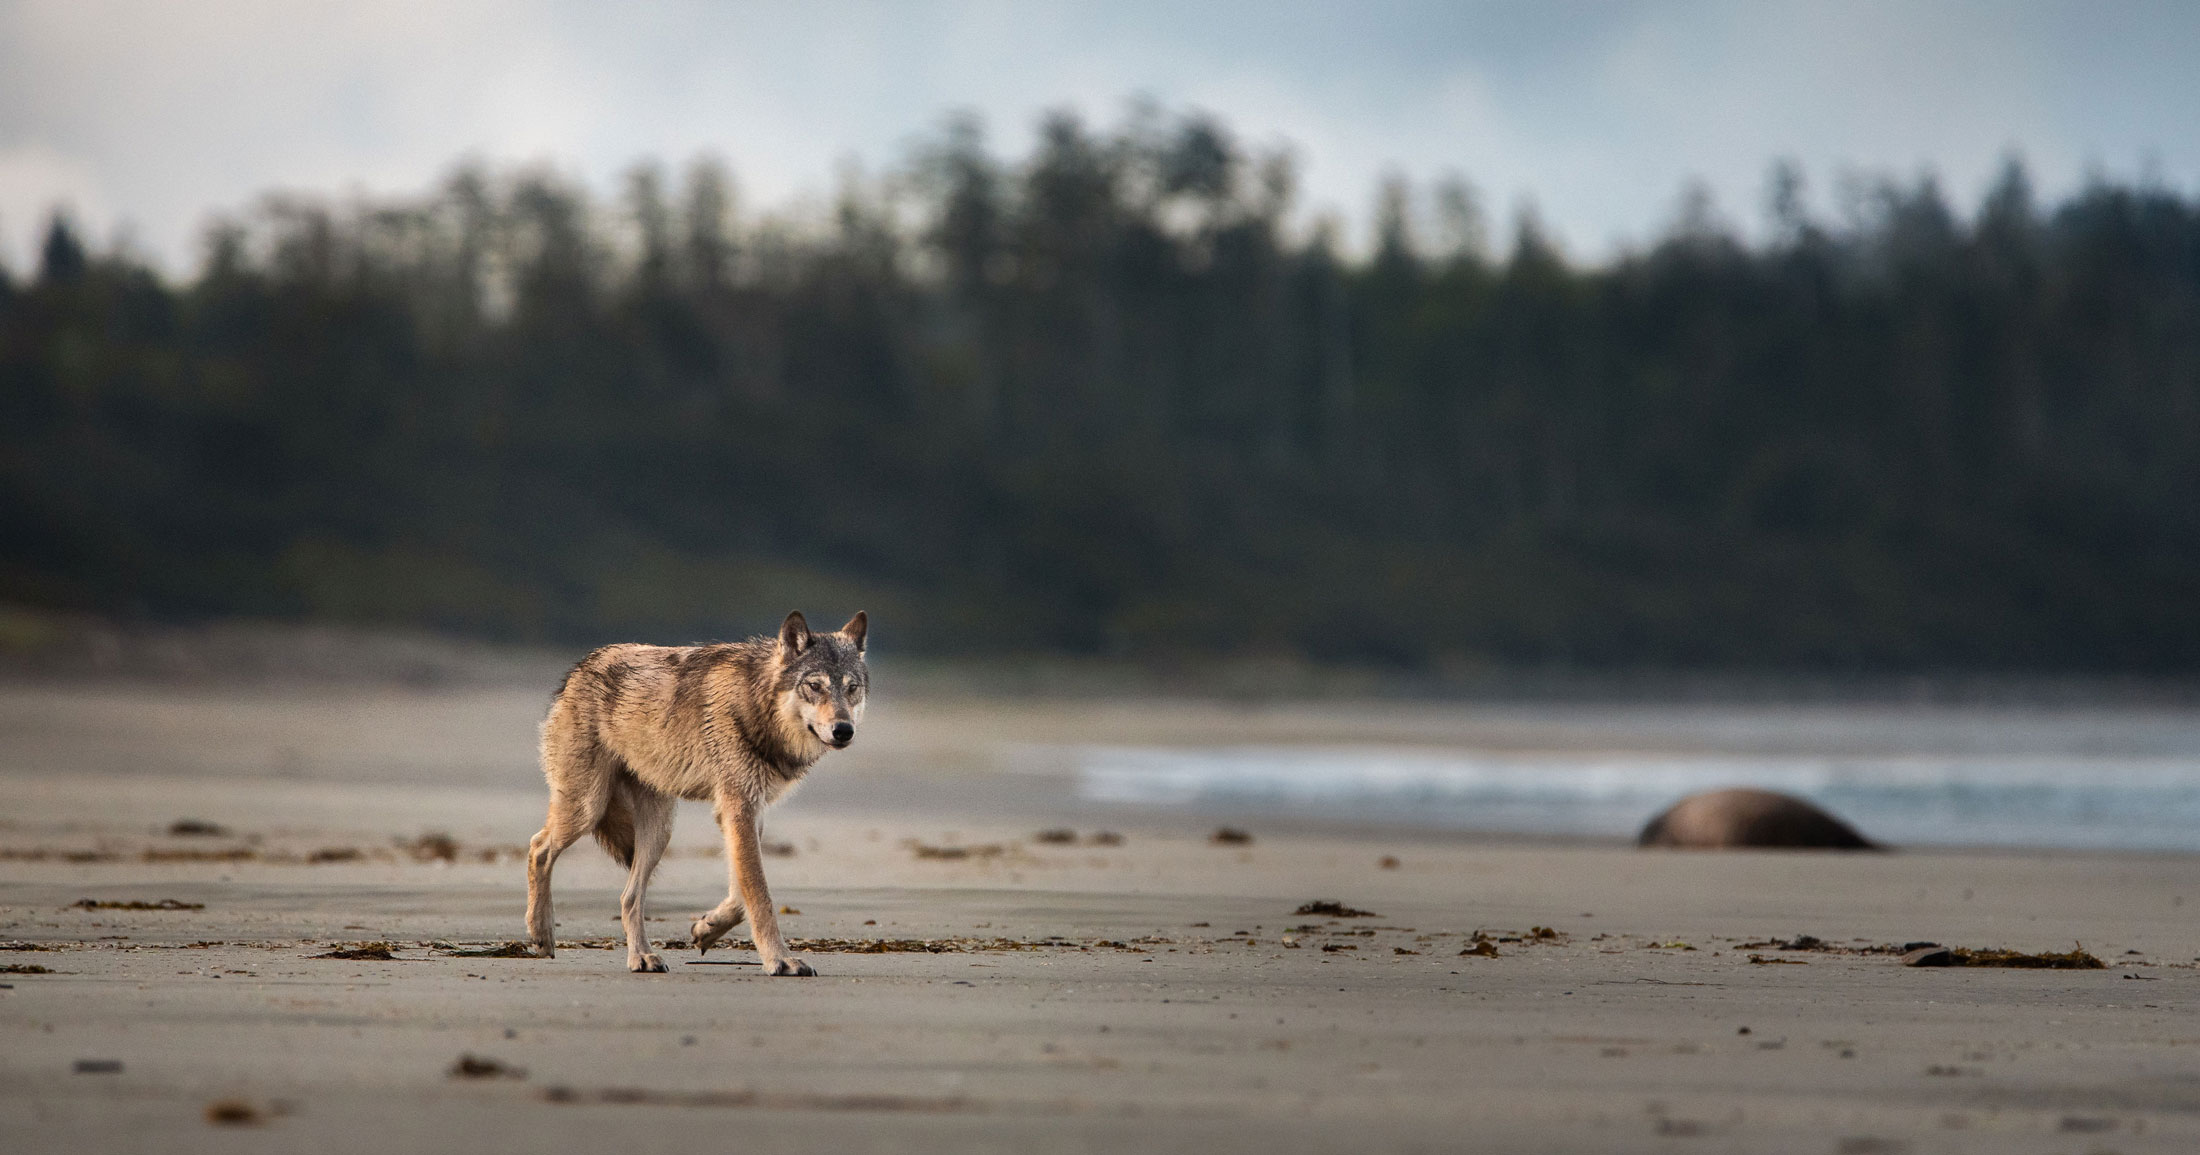
We investigate to understand coastal species and processes. We inform by bringing science to decision-makers and communities. We inspire action to protect wildlife and wildlife habitats.