Preliminary Results – drift cards
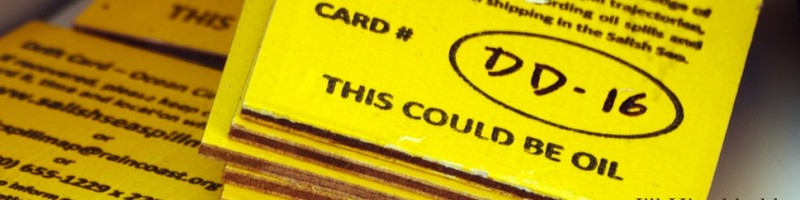
Now in its second year, the Salish Sea Spill Map Project has generated a large amount of data. We are updating our Spill Map Project Results (PDF) from the fall of 2013 to include recoveries from 2014. Notably, many of the recoveries in 2014 were still from our October 2013 card drops, where we released 1,644 drift cards at nine locations along the shipping route. We continued to release cards in 2014, with drops in February and March at Turn Pt. and Rosario Strait, and again in August and September in the Fraser River, Vancouver, the south Strait of Georgia, Turn Pt. and Rosario Strait.

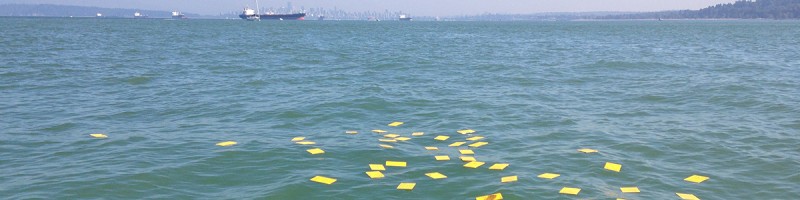
So far, out of roughly 4,000 cards launched, we have received more than 1,500 recoveries – 30 percent. While some drops have yielded very high recovery rates, others have not. By returning to the same location many times, such as Turn Point at the intersection of Boundary Pass and Haro Strait, we hope to gain a better understanding of seasonal and other variables controlling the movement of cards, and oil.
Kinder Morgan has undertaken oil spill modeling in this Turn Point location, and our study will be compared to their results. For example, Kinder Morgan’s spill scenario runs for only 15 days, after which almost 80% of the oil would be stranded on shorelines (note: there are many assumptions and caveats to their modeling). But what would happen after 15 days to oil still floating or not “recovered”? Our cards suggest that currents could carry it up the west coast of Vancouver Island, and even to BC’s central coast and Haida Gwaii. Although this may seem unlikely, the Nestucca oil spill in 1988 taught us that it is not an improbable outcome.
So far, the study has revealed a number of important findings:
- An oil spill in the Strait of Georgia would likely have major trans-boundary implications, involving both Canadian and American waters and coastlines.
- Many areas, including Victoria and the San Juan Islands, received cards from numerous drop locations along the shipping route, highlighting their potential susceptibility to oil spills.
- Many areas received cards from drops in different seasons, tidal cycles, and different locations, showing these locations are at higher risk.
- Information can be gained from low-budget, empirical studies like drift cards that can be used to complement and compare to expensive, proprietary and non-public modeling.